Writing
Power BI, data, automation and whatever else is on my mind.
Deep Power BI one week, AI and design the next. Useful beats perfect.
What Microsoft Fabric Actually Is, in Plain English
Fabric is Microsoft bundling its separate data tools into one product you buy as a block of compute rather than per person. If your reporting problem is that reports disagree with each other, Fabric is not the answer to it.
Row-Level Security, Explained for Business Owners
Row-level security means one report where each person sees only their own slice of the data: their region, their branch, their accounts. It's cheap to design in from the start and expensive to bolt on later, which is why it belongs in the first conversation rather than the last.
Power BI Training: What a Day Costs in the UK and What It Covers
My published Power BI training rates run from £750 for a 1-2-1 day online to £1,500 for an in-person team day of up to ten people, and every day includes a half-day of prep on your own data. Here is the full price table, what each format buys, and when training beats hiring a consultant.
Why Your Power BI Refresh Keeps Failing
Nearly every failing Power BI refresh comes down to one of four causes: expired credentials, a gateway problem, a source that changed shape, or a timeout. Here is how to tell which one you have, what fixing each involves, and why the failures you don't hear about are the expensive ones.
Power BI vs Excel: When the Spreadsheet Is the Right Answer
Excel wins for modelling, one-off analysis, and anything where the person doing the work is the only person who needs the answer. Power BI wins when the same question gets asked repeatedly by people who need to trust the number without rebuilding it.
What to Prepare Before You Brief a Power BI Consultant
The best brief answers two questions: which decisions should this reporting support, and who makes them. Bring those, your systems list and an access owner. Skip the chart mock-ups and the forty-page requirements document.
Why Is Your Power BI Report Slow?
Ranked by likelihood: the shape of the data model, pages doing too much, DirectQuery used where it shouldn't be, and only then the DAX. Match your symptom to the likely cause, and what fixing each one honestly takes.
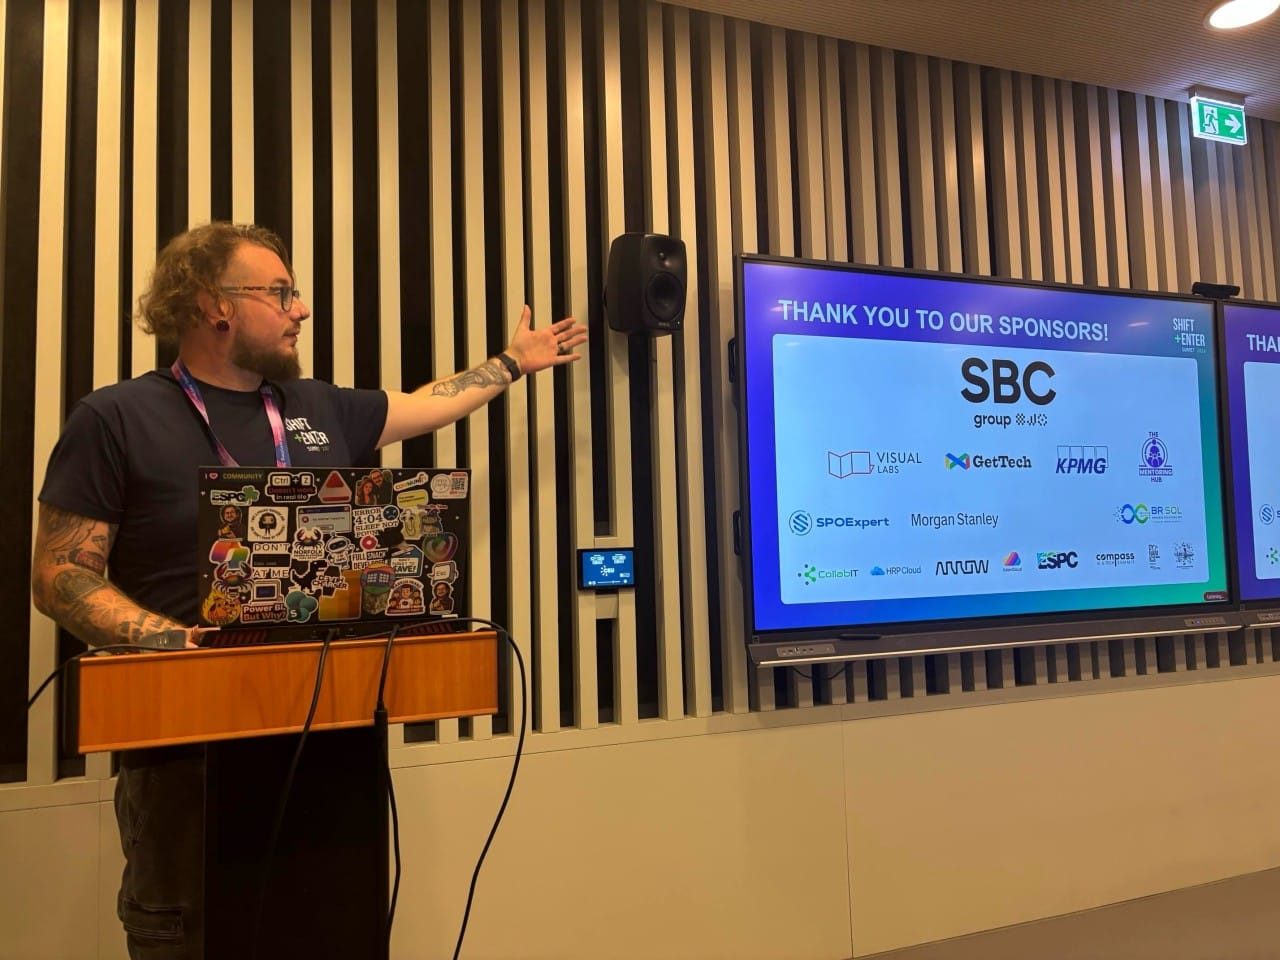
I raced an AI in Budapest, and it fell over on colour
Shift+Enter Summit, 4 September, Budapest. I built a dashboard live in 45 minutes while an AI built one from the same brief on the same clock. It got the numbers right and the reading wrong.
What Is a Semantic Model? A Plain-English Answer
A semantic model is one agreed set of definitions for your business numbers: the data, how it connects, and every calculation defined once. Reports are windows onto it, which is why the model, not the dashboard, is the thing you're actually buying.
How Long Does a Power BI Project Take?
A fix takes hours, a single dashboard takes days, a first reporting system takes about three weeks, and a multi-department build takes months. The build is rarely the slow part: data quality, access and unmade decisions are what stretch a Power BI timeline.
Power BI for Small Businesses: What You Actually Need
Most UK small businesses need four tables, two questions answered properly, and about £11 a month per person in licensing. Almost everything else sold under the heading of business intelligence is for a company several sizes larger than yours.
How Much Does a Power BI Dashboard Cost to Build?
A single well-built report on data that is already clean runs into the low thousands. A reporting system several people depend on is closer to £9,500. The variable that moves the number most is not the dashboard at all, it's the state of the data underneath it.
What Power BI Licensing Actually Costs in the UK (2026)
Power BI Pro is £10.80 per user per month and Premium Per User is £18.50, both paid yearly, on Microsoft's UK price list as of September 2026. The harder question is when you stop paying per person and start paying for capacity, and the answer turns on one number: F64.
How to Choose a Power BI Consultancy in the UK
Choose on five things you can verify: published pricing, who actually does the work, evidence of delivery, size fit, and what you own at the end. Includes the kinds of firm to shortlist when I am not the right answer.
What's Actually in a Power BI Health Check
A proper Power BI health check is a scored review against a written standard: 48 checks across six areas, each returning Healthy, Watch or Critical. Here's exactly what gets checked, how the scoring works, and what the report card looks like.
Business Intelligence Tools for UK Small Businesses: Which One, and When You Actually Need One
A small business needs a business intelligence tool when its reporting has to combine more than one system, reach more than a few people, or update without someone rebuilding it. Until then, the accounting system and a tidy spreadsheet are enough, and that's fine. Here's how to tell which side of that line you're on, and what the realistic options are for a UK SME.

Five bronze awards, and the one that made me laugh
Five emails turned up eleven minutes apart on a Friday night. Two of the awards are mine, three belong to a team of volunteers, and one of them is very funny if you have ever met me.
Power BI Support: What £250 a Month and £1,750 a Month Actually Buy
Published UK Power BI support retainers run from £250 a month to £8,250. The gap is not thirty three times the work. Here is what each band actually includes, and the two questions that tell you which one you need.
How Much Does a Power BI Consultant Cost in the UK? (2026)
UK Power BI contract day rates run £320 to £656, median £490 (ITJobsWatch, six months to 26 August 2026). But day rate is only one of four ways this work gets priced. Here is what each shape costs, what it does to your risk, and every price I charge.
The Daily Sales Report That Builds Itself Before You Get In
A daily sales report shows yesterday's sales against the same day last year and against target, month to date, by the two or three splits that matter, on one page, in your inbox before 8am. Here is what goes on it, what to leave off, and how to have it arrive every morning without anyone building it.
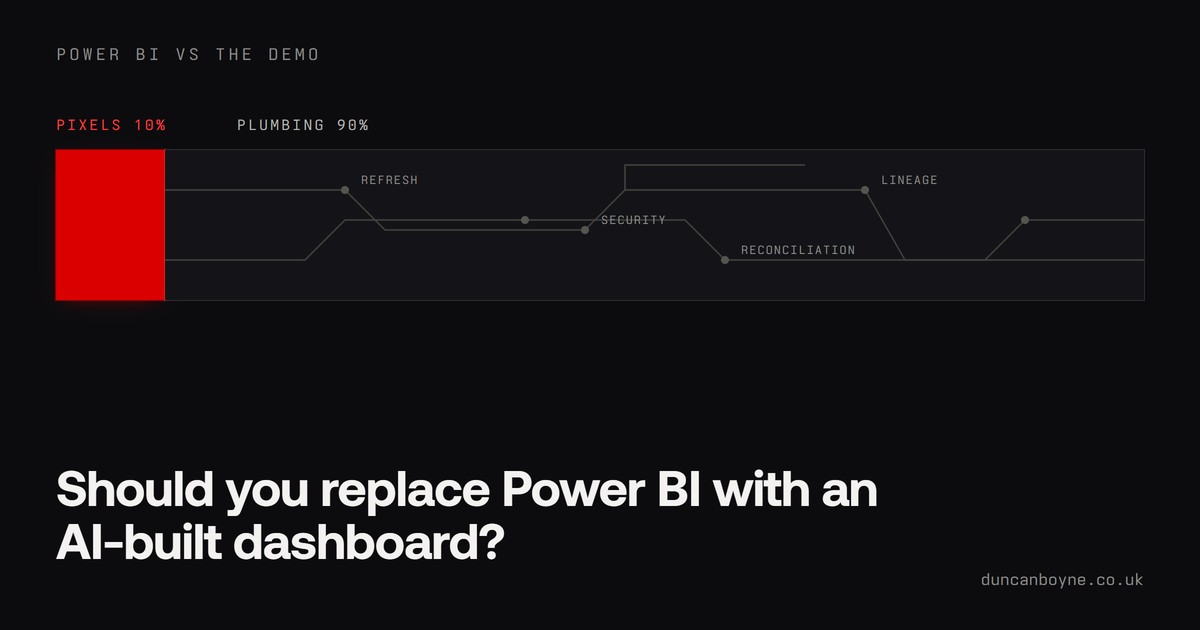
Should You Replace Power BI with an AI-Built Dashboard?
A CEO sees an AI-built dashboard, calls it stunning, and asks why you still pay for Power BI. It happened on r/PowerBI this week and it is coming to a meeting near you. What the demo is not showing, when a web app genuinely wins, and what to say in that meeting.
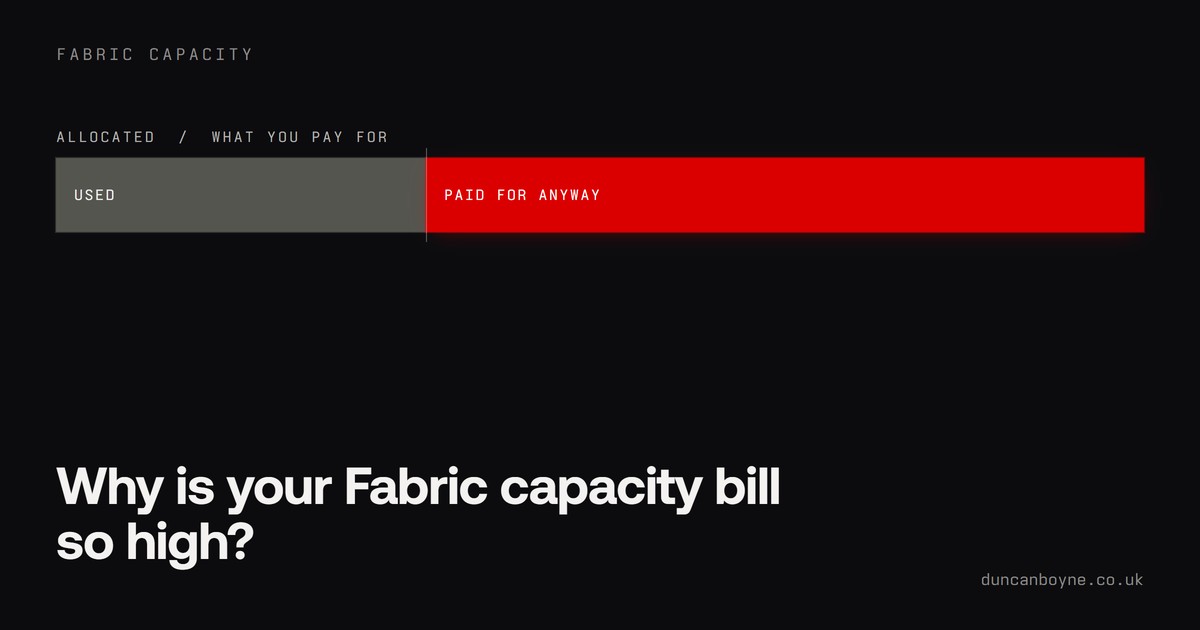
Why Is Your Fabric Capacity Bill So High?
Fabric charges for the compute you allocate, not the compute you use. That one fact explains most frightening capacity bills. How the billing works in plain English, the five usual culprits, the three cost features Microsoft shipped in a single week, and the triage to run first.
When Should You Move to Microsoft Fabric?
The most-watched Fabric video this week is 22,000 people asking the same question. The honest answer: move when your Power BI estate starts fighting its own workarounds, stay put while Pro is coping. The signs for each, what changed in August 2026, and the low-risk way in.
The Monthly Report Template That Updates Itself
A monthly business report has the same six sections every month: headline numbers, what changed, sales, operations, people, and what's next. Here's the template, why it works, and how to build it so the numbers fill themselves in on the first of the month and the only thing left to write is the commentary.

Getting Your Year End Reporting Ready Before the Auditors Arrive
Year end reporting is a project in itself: reconciling, chasing invoices, departmental spends, forecasts, budgets. Get your Power BI reports ready before the deadline, or hand the auditors an audit pack and let them check it themselves. Epicor, Infor, D365 and everything in between.
Financial Reporting Software for UK SMEs: What Your Accounting System Already Gives You, and When Power BI Sits on Top
For most UK SMEs the best financial reporting software is the accounting system you already have, used properly, with Power BI added on top when reporting needs to combine finance with sales, operations or people data, reach people outside finance, or show trends the ledger can't. Here's what Xero, QuickBooks, Sage and Business Central each give you and where the line is.
Small Business Dashboard Examples: What Eight Kinds of UK Business Actually Track
A good small business dashboard shows five to eight numbers the owner looks at weekly, each compared with a target or last year, on one page. Here are worked examples for eight common UK business types, what each one tracks and why, and what they have in common.
The 13-Week Cash Flow Forecast: A Template You Can Build This Week, Then Stop Rebuilding
A 13-week cash flow forecast is a weekly, rolling view of cash in and cash out for the next quarter, built from open invoices, known payments and expected sales rather than from the P&L. Here is the template row by row, how to keep it honest, and how to make it refresh itself from your systems.
Sage Intacct Reporting: What the Built-in Reports Do Well, and When to Put Power BI on Top
Sage Intacct's own reporting is strong for anything that lives inside the ledger: dimensional P&Ls, multi-entity consolidation, financial report writing. Power BI earns its place when you need to combine Intacct with CRM, operations or people data, give reports to people without an Intacct login, or model things the ledger doesn't hold. Here's how to decide.
What Goes in a Monthly Management Accounts Pack (and How to Have It Ready by Day Five)
Monthly management accounts are the internal P&L, balance sheet, cash and KPI pack a business uses to run itself, produced within days of month-end rather than months later. Here is what a good pack contains, who it's for, and how to get it landing by working day five without anyone working the weekend.
A Board Report Template That Gets Read (and Stops Being Rebuilt Every Month)
A good board report is six to ten pages, opens with a one-page summary the chair can read in five minutes, and every number on it traces back to a system. Here is the template, section by section, and how to make it build itself each month.

The Colour Crash
LEGO went from ten colours a year to 113, then crashed to 59. The company nearly died in the middle, and nobody wrote that story down. The data recorded it anyway. My Power BI Dataviz World Champs entry, live and clickable, plus everything that broke on the way.

The Report I Never Submitted
I found $2.4M hiding in a gap of less than half a percent, planned five pages around it, then talked myself out of entering. Round 1 of the Power BI Dataviz World Champs, and the report nobody was supposed to see.
Still Paying to Keep a Dead ERP Alive Just for the History?
Licence, support, a server and somebody's Friday afternoon, all to answer a question an auditor asks twice a year. How to archive the history into Power BI, reconcile it to zero, hand over an audit pack, and switch the old system off.
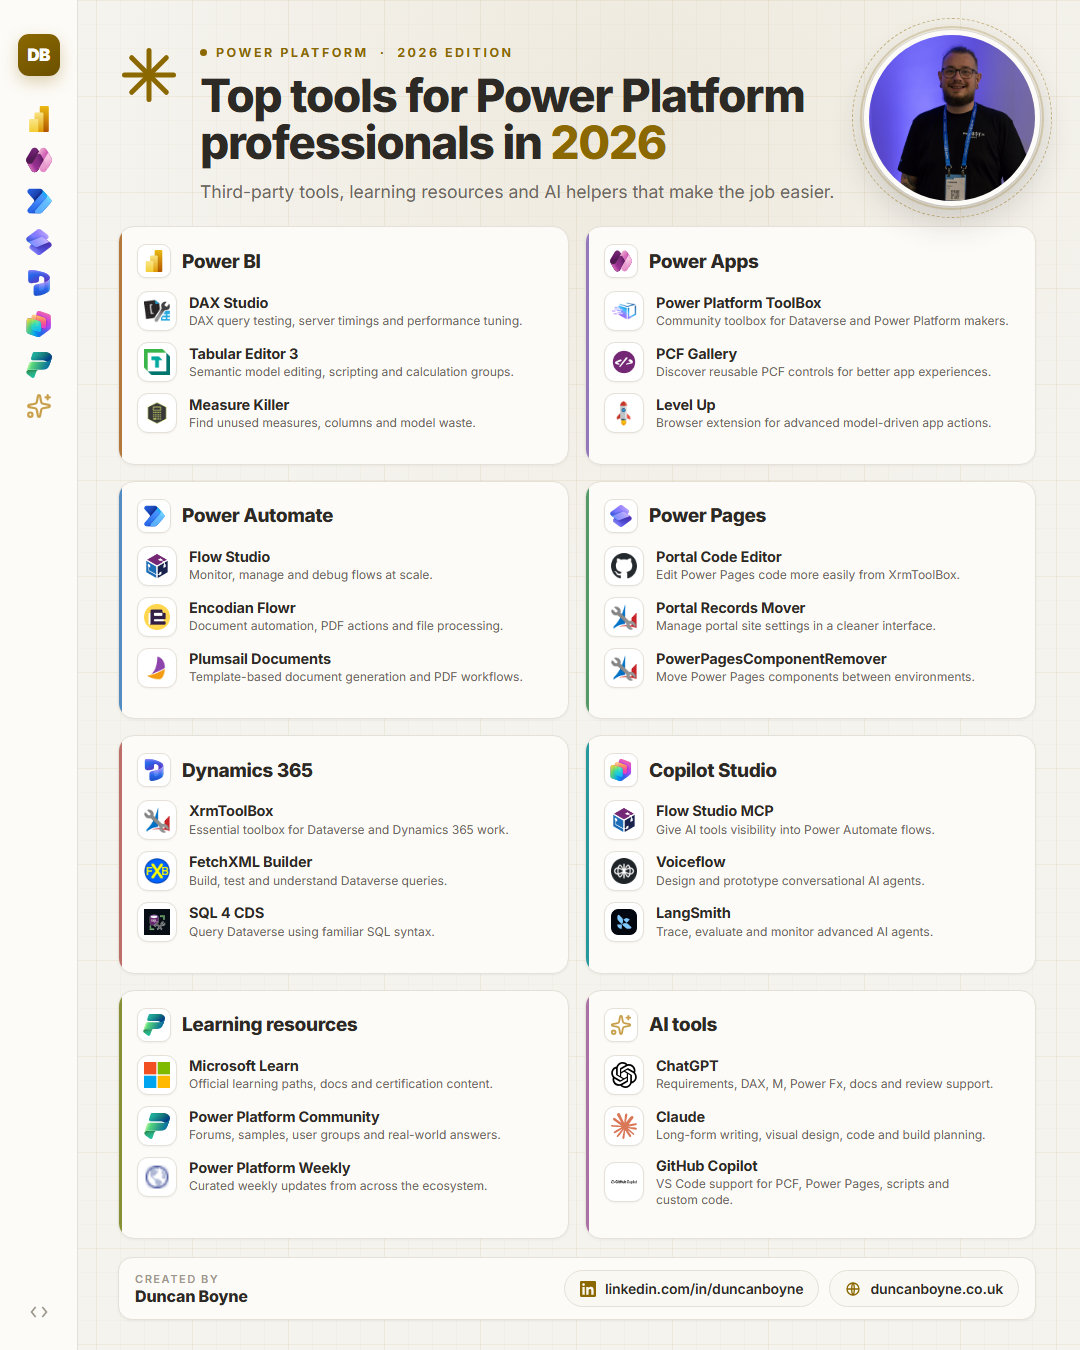
Top Tools for Power Platform Professionals in 2026
A practical 2026 list of Power Platform tools worth knowing across Power BI, Power Apps, Power Automate, Power Pages, Dynamics 365, Copilot Studio, learning resources and AI.

I Asked AI for a Website. It Built a Cathedral.
When Claude Fable dropped, everyone built the same landing page. I asked it for a living cathedral instead — where the floor is data quality, the pillars are revenue, and your decisions crack the foundations while you watch. Here's what it built, what broke, and why the idea still matters more than the tool.
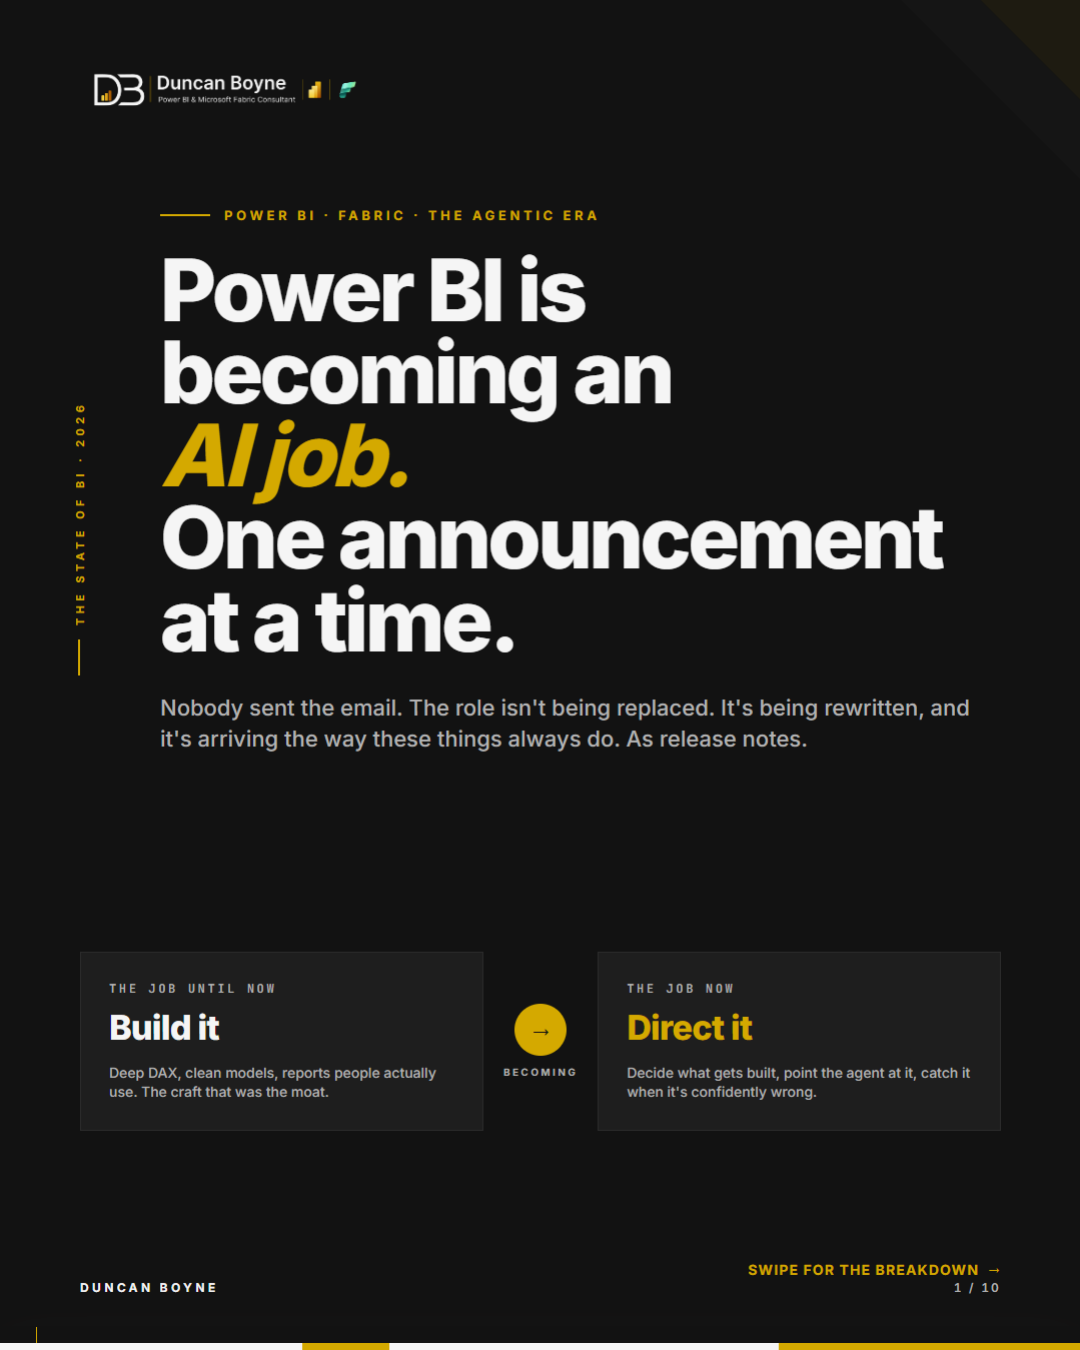
Power BI Is Becoming an AI Job, One Announcement at a Time
Five Power BI and Fabric announcements landed in one week. Taken together, they reveal a job shifting from building reports to directing agents, governing semantic layers, and knowing when the confident answer is wrong.
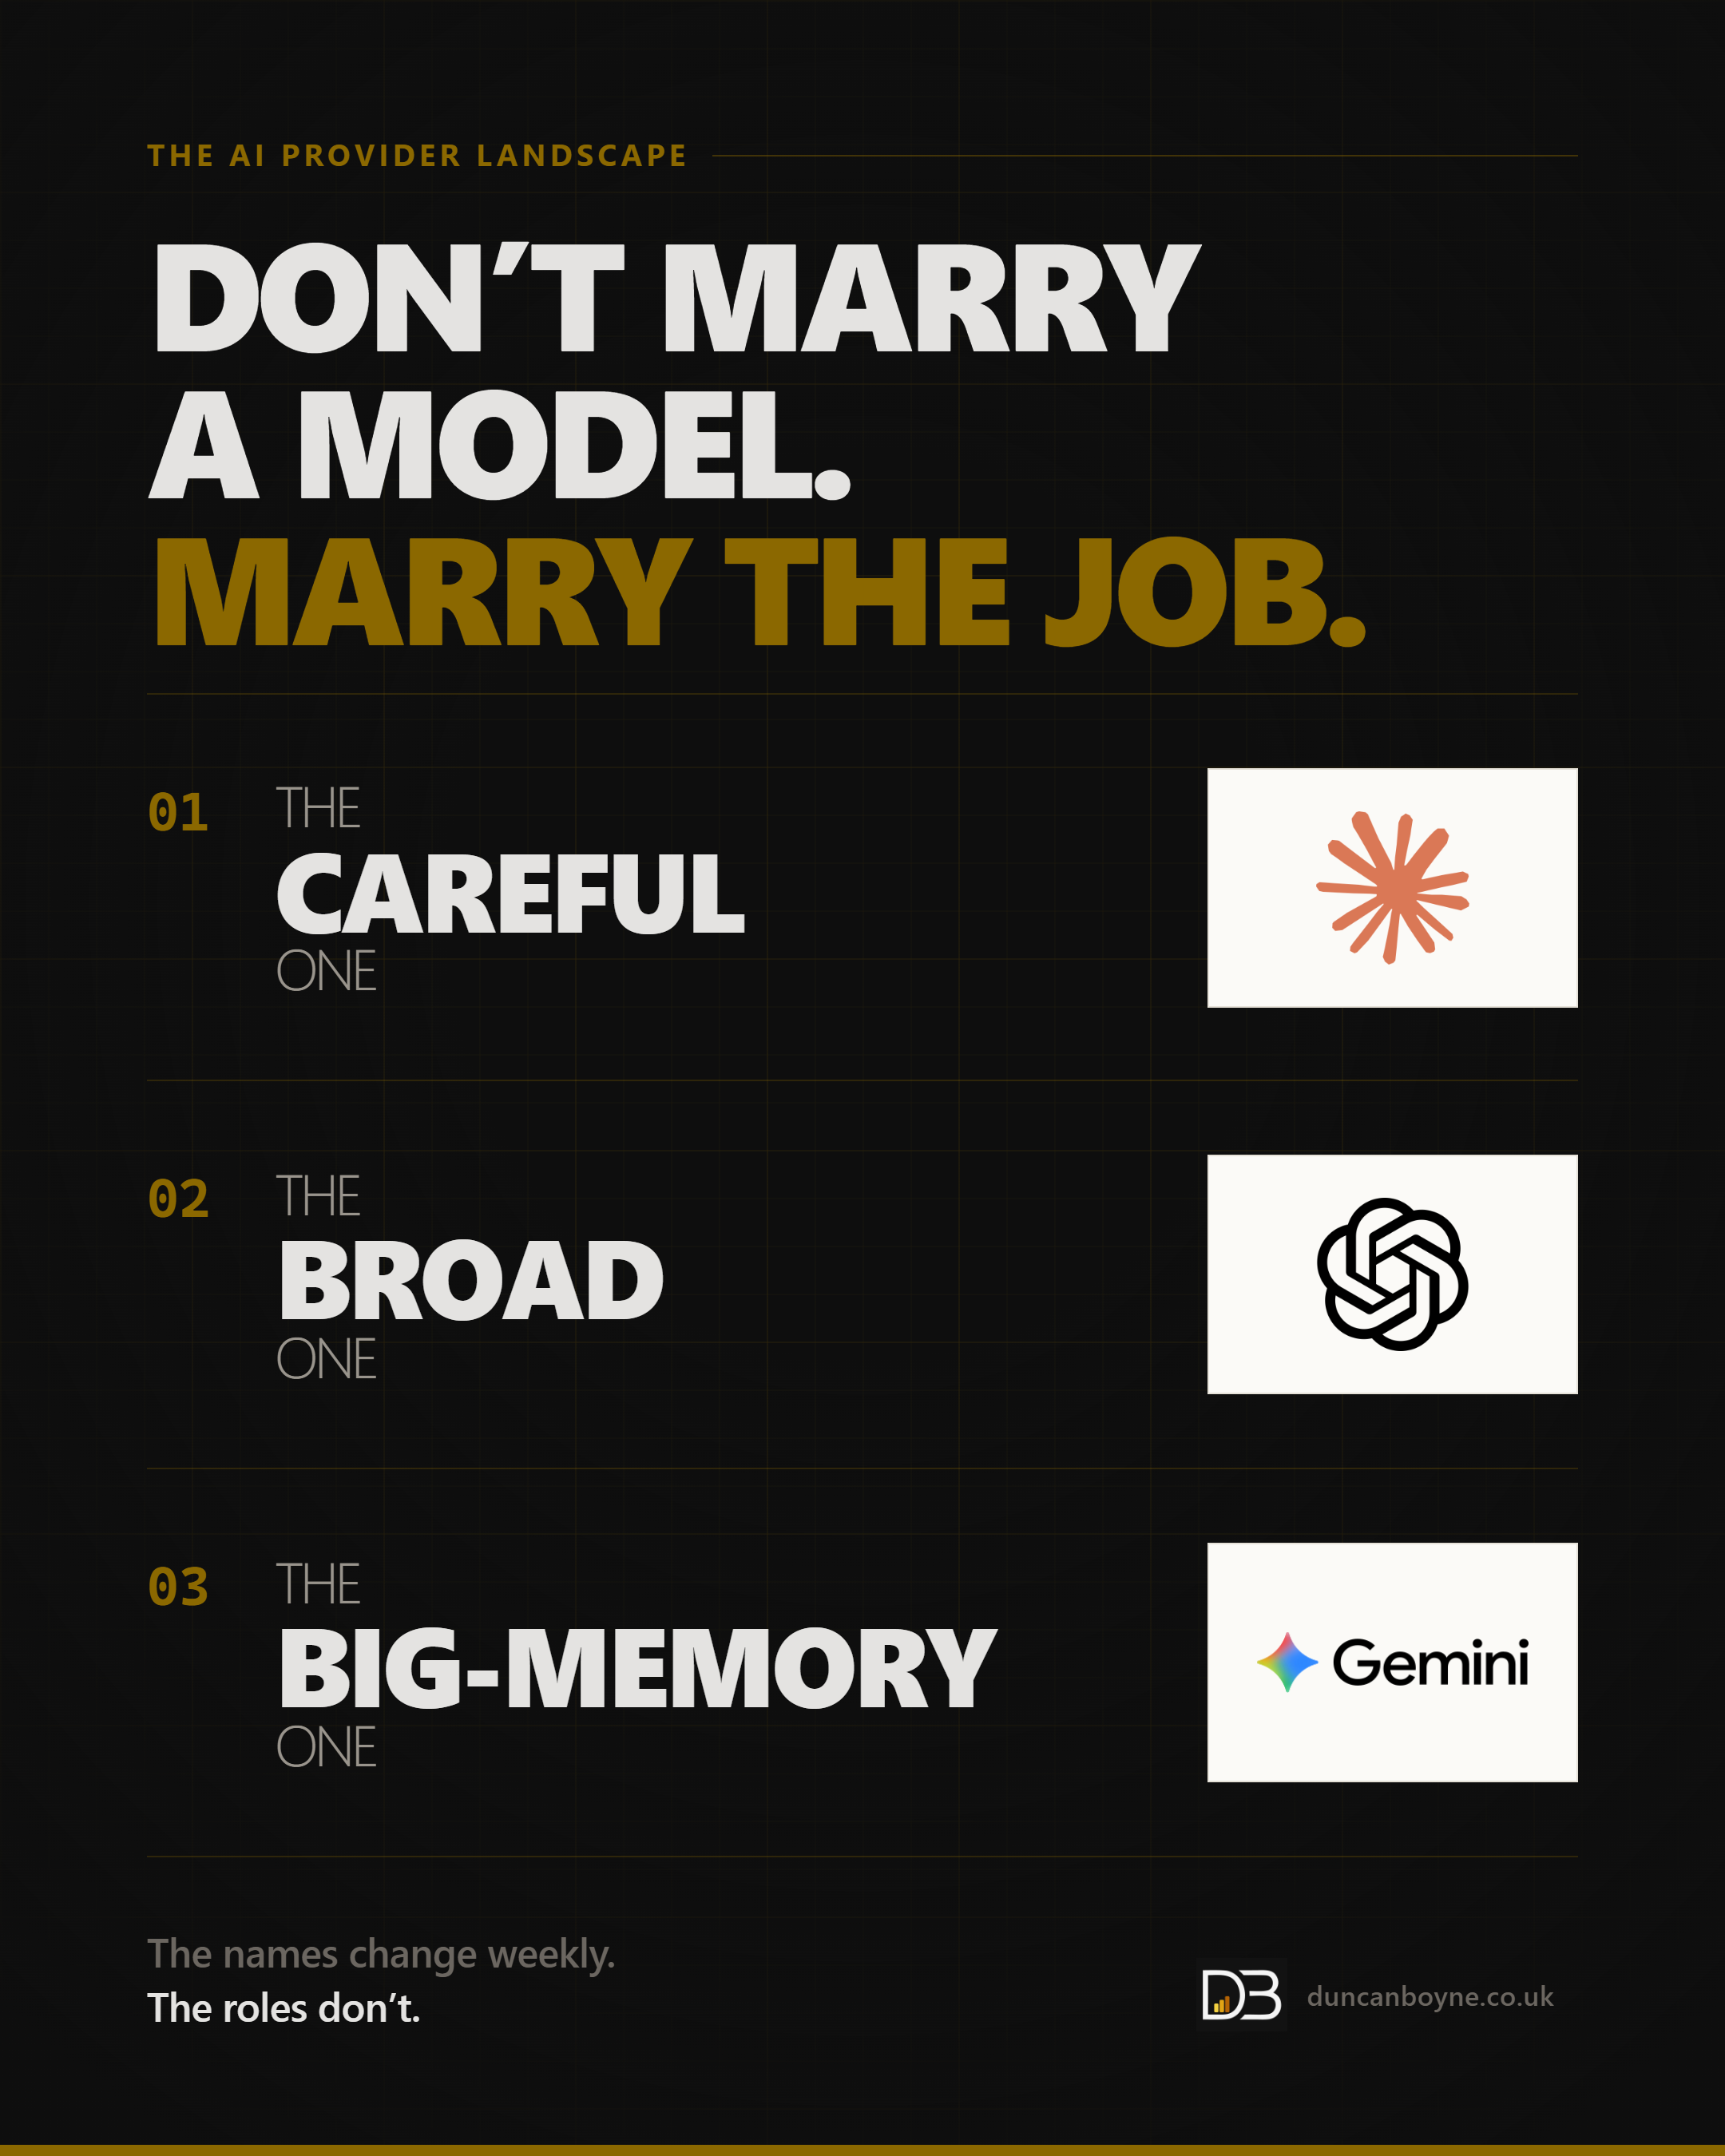
Three Tools, One Question: Which AI Actually Does Your Job?
The big three AI generalists aren't competing to be best — they've split the map. Claude for careful building, GPT for the broadest toolbox, Gemini for mountains of context. Here's what I actually reach for in mid-2026, where each one falls flat, and the niche players worth knowing. Don't marry a model. Marry the job.
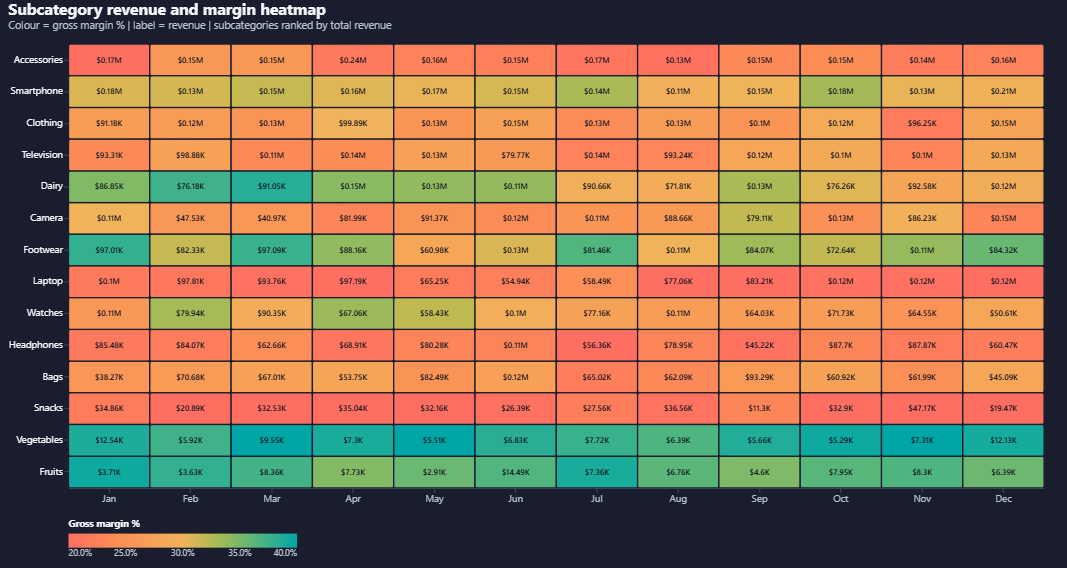
Build a two-measure heatmap in Power BI with Deneb
Power BI has no native heatmap. Here's how to build a better one in Deneb and Vega-Lite, with gross margin as the cell colour and revenue as the label, plus the full copy-paste spec.
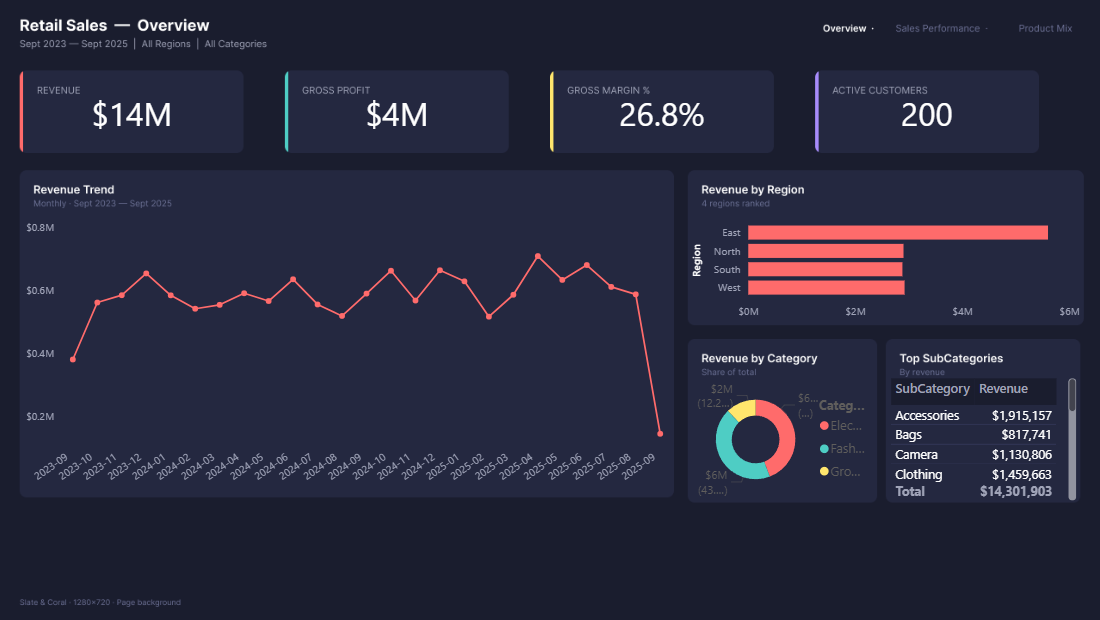
Building a Power BI report without opening Desktop
I built a three-page Power BI report through Claude Code, Figma MCP, powerbi-modeling-mcp, and pbi-cli without opening Desktop until validation. This is the honest pipeline and the twelve things that went wrong.
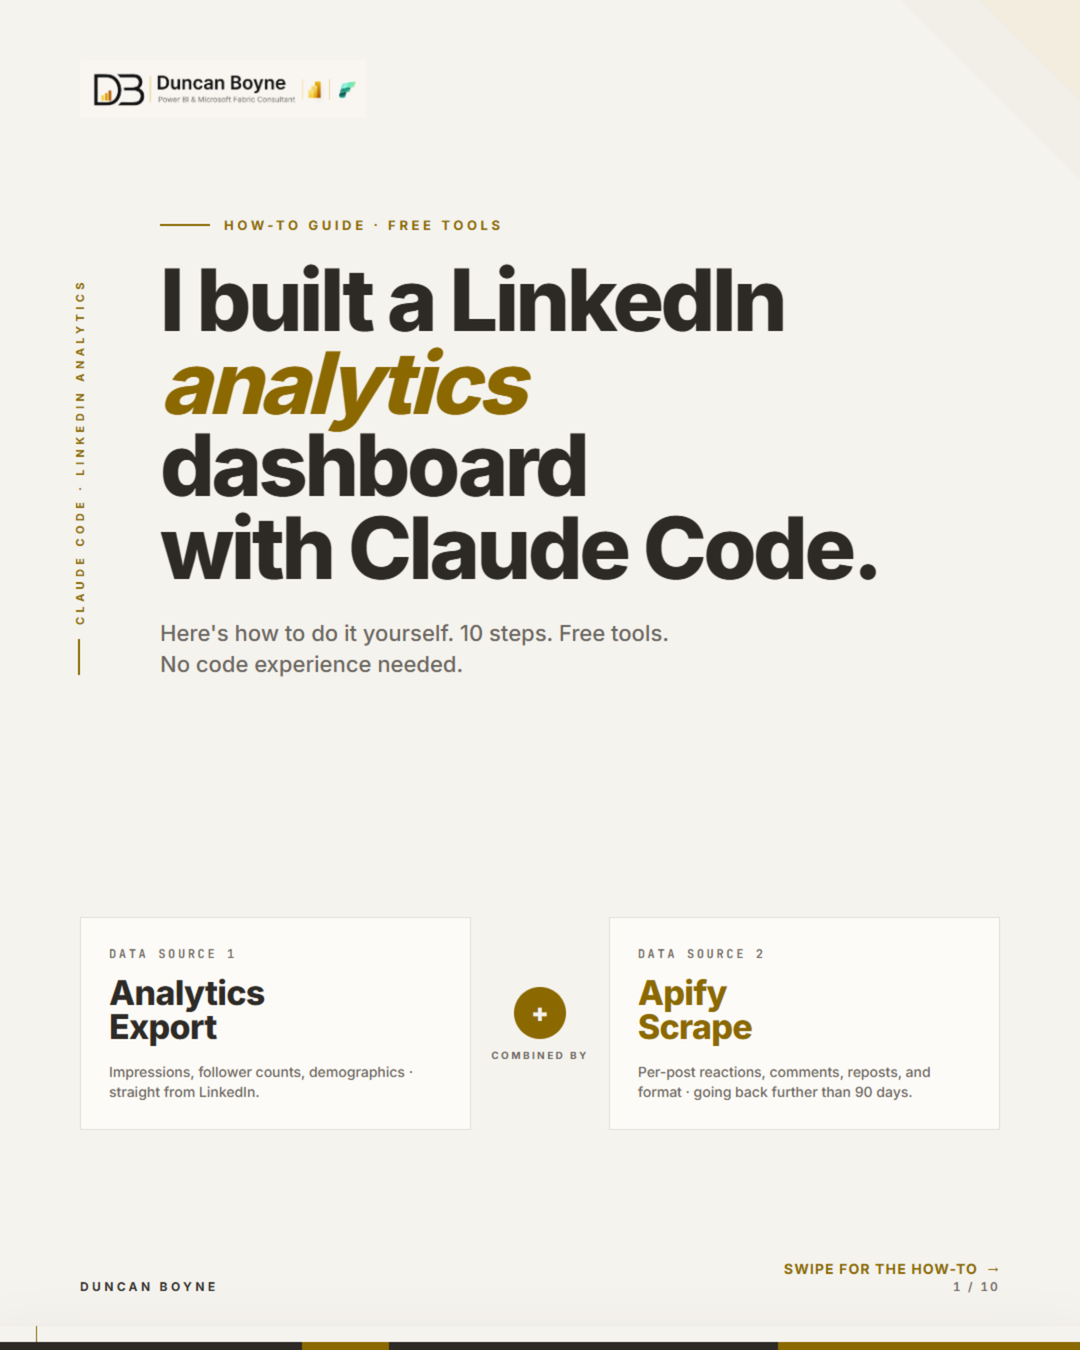
How I Built a LinkedIn Analytics Dashboard with Claude Code (and Open-Sourced It)
LinkedIn gives you 90 days of analytics. I wanted more. So I built a dashboard that combines the official export with an Apify scrape to show content format performance, day-of-week patterns, post quadrants, and full audience demographics — then open-sourced it as a Claude Code skill.
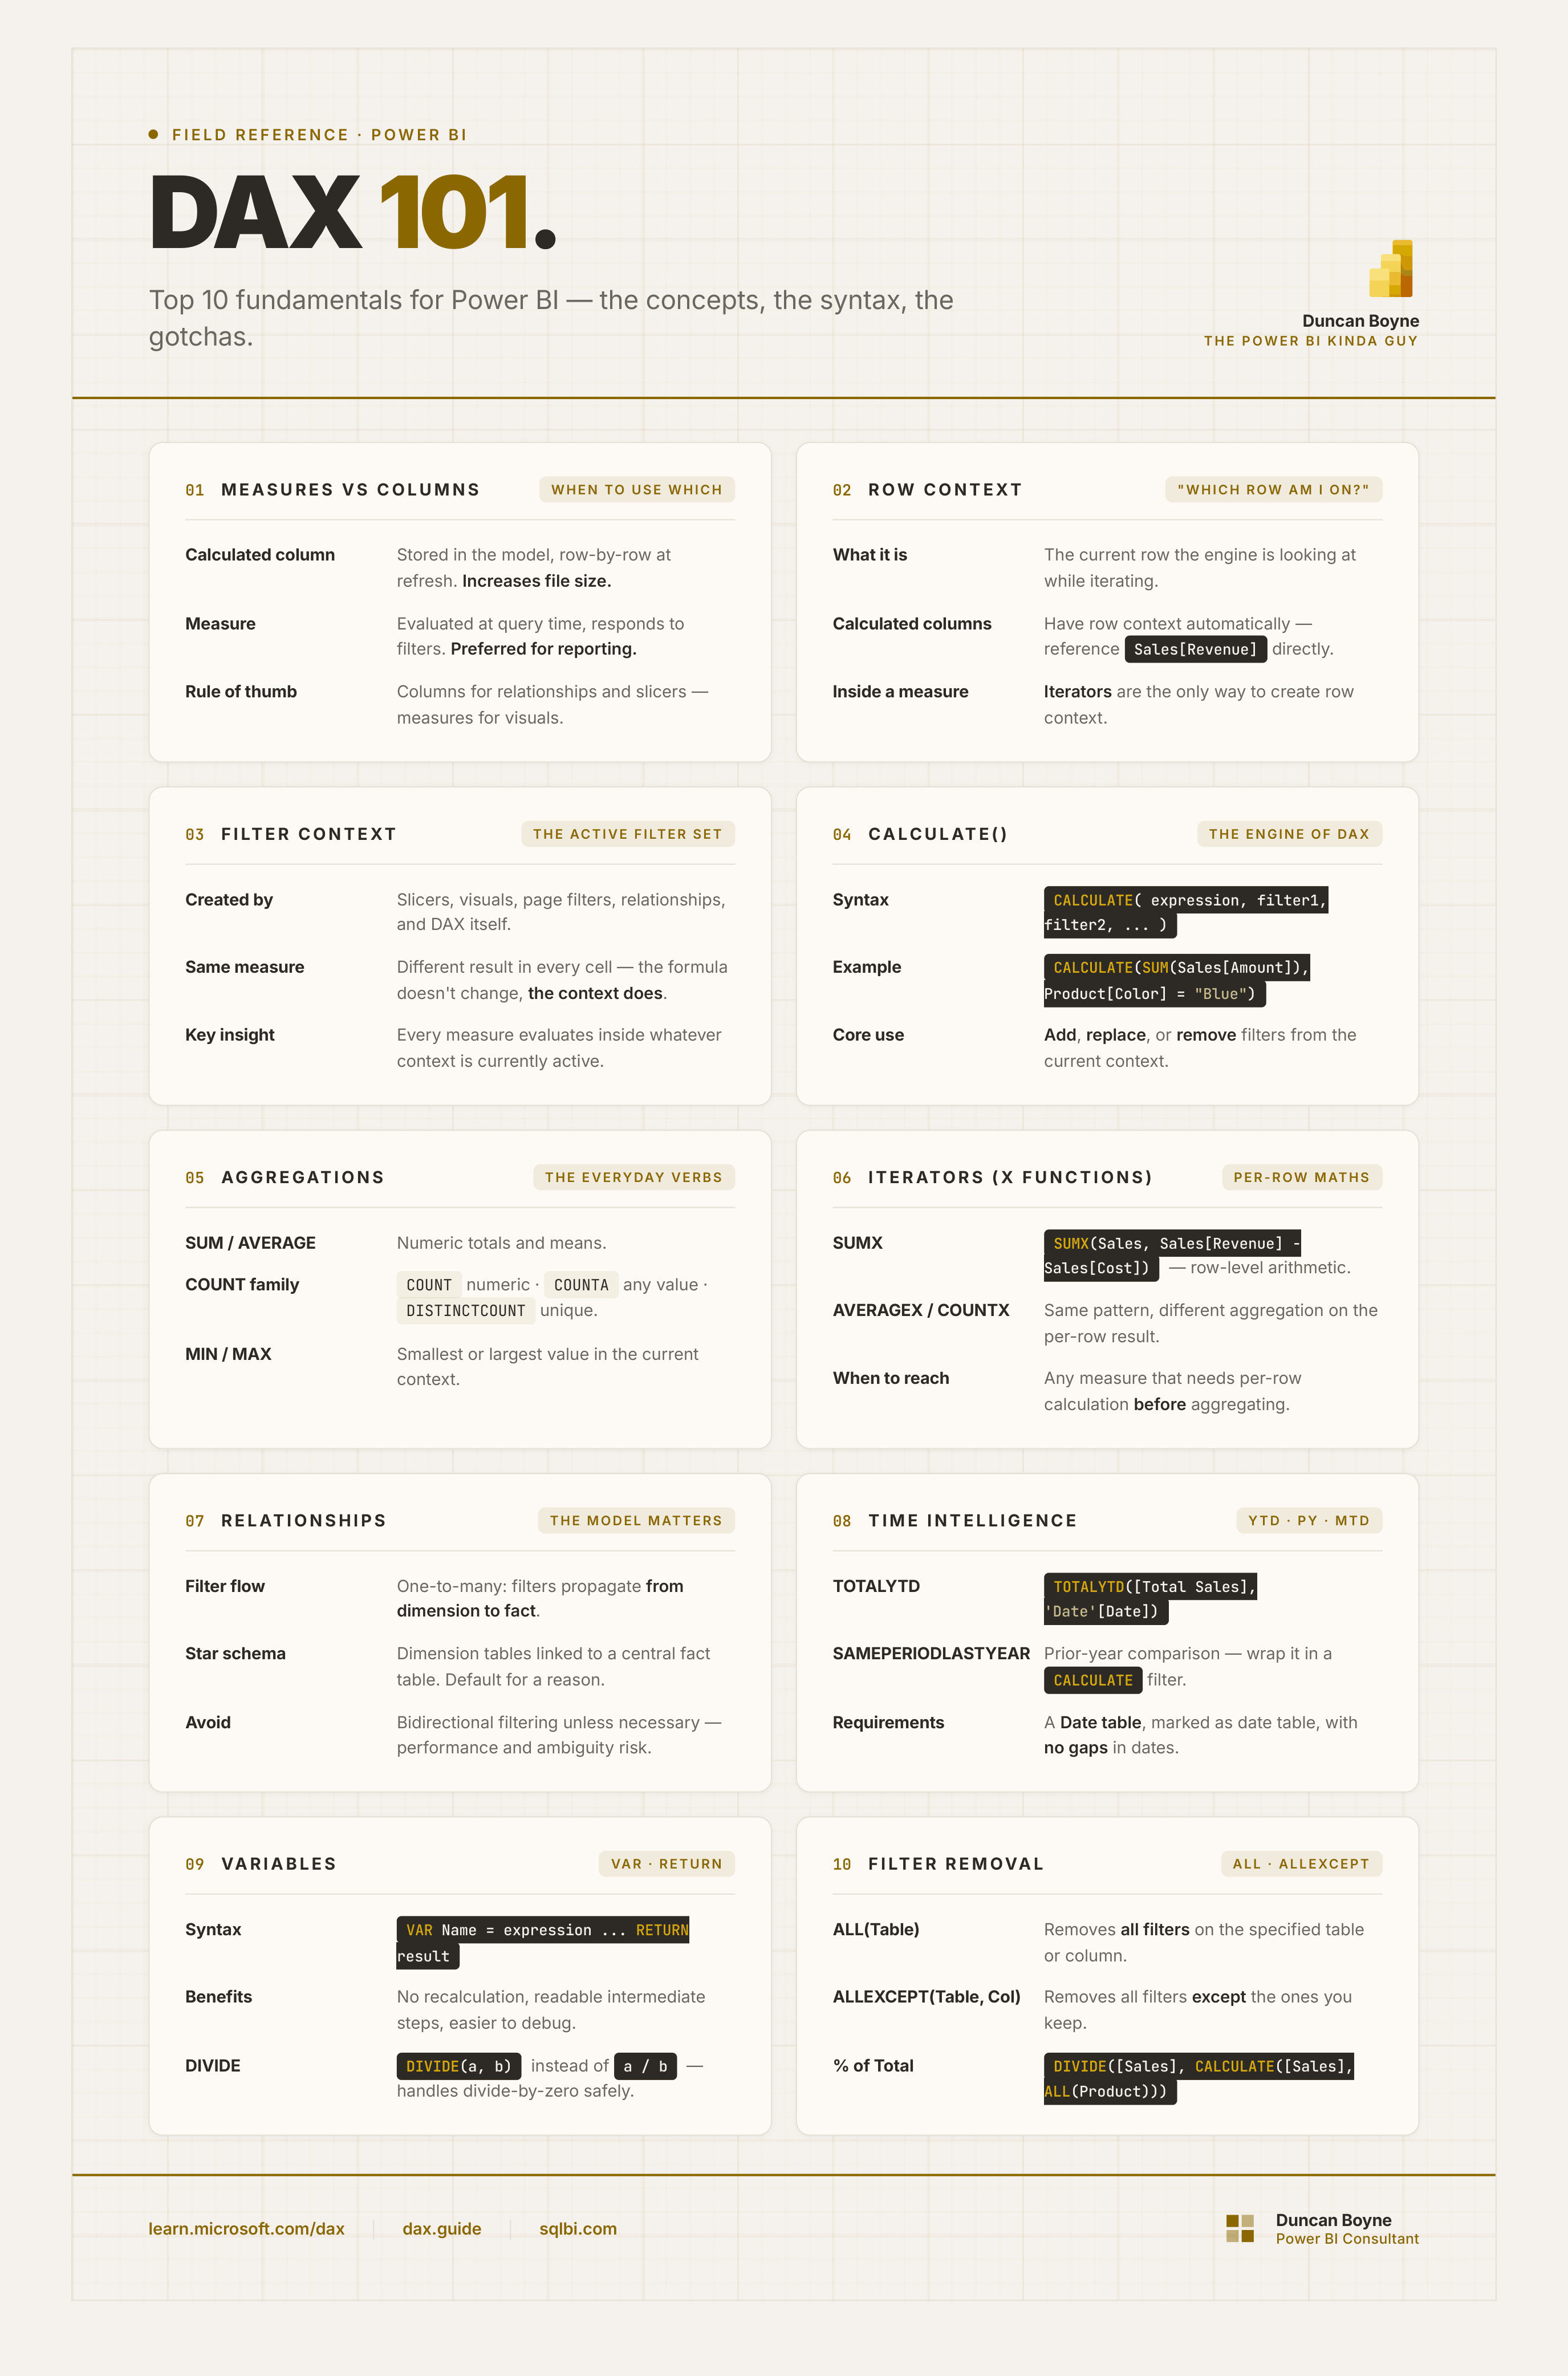
Top 10 DAX Fundamentals for Power BI
DAX is not hard. But it is different. These are the 10 concepts I would teach someone starting from scratch — the things that unlock everything else.
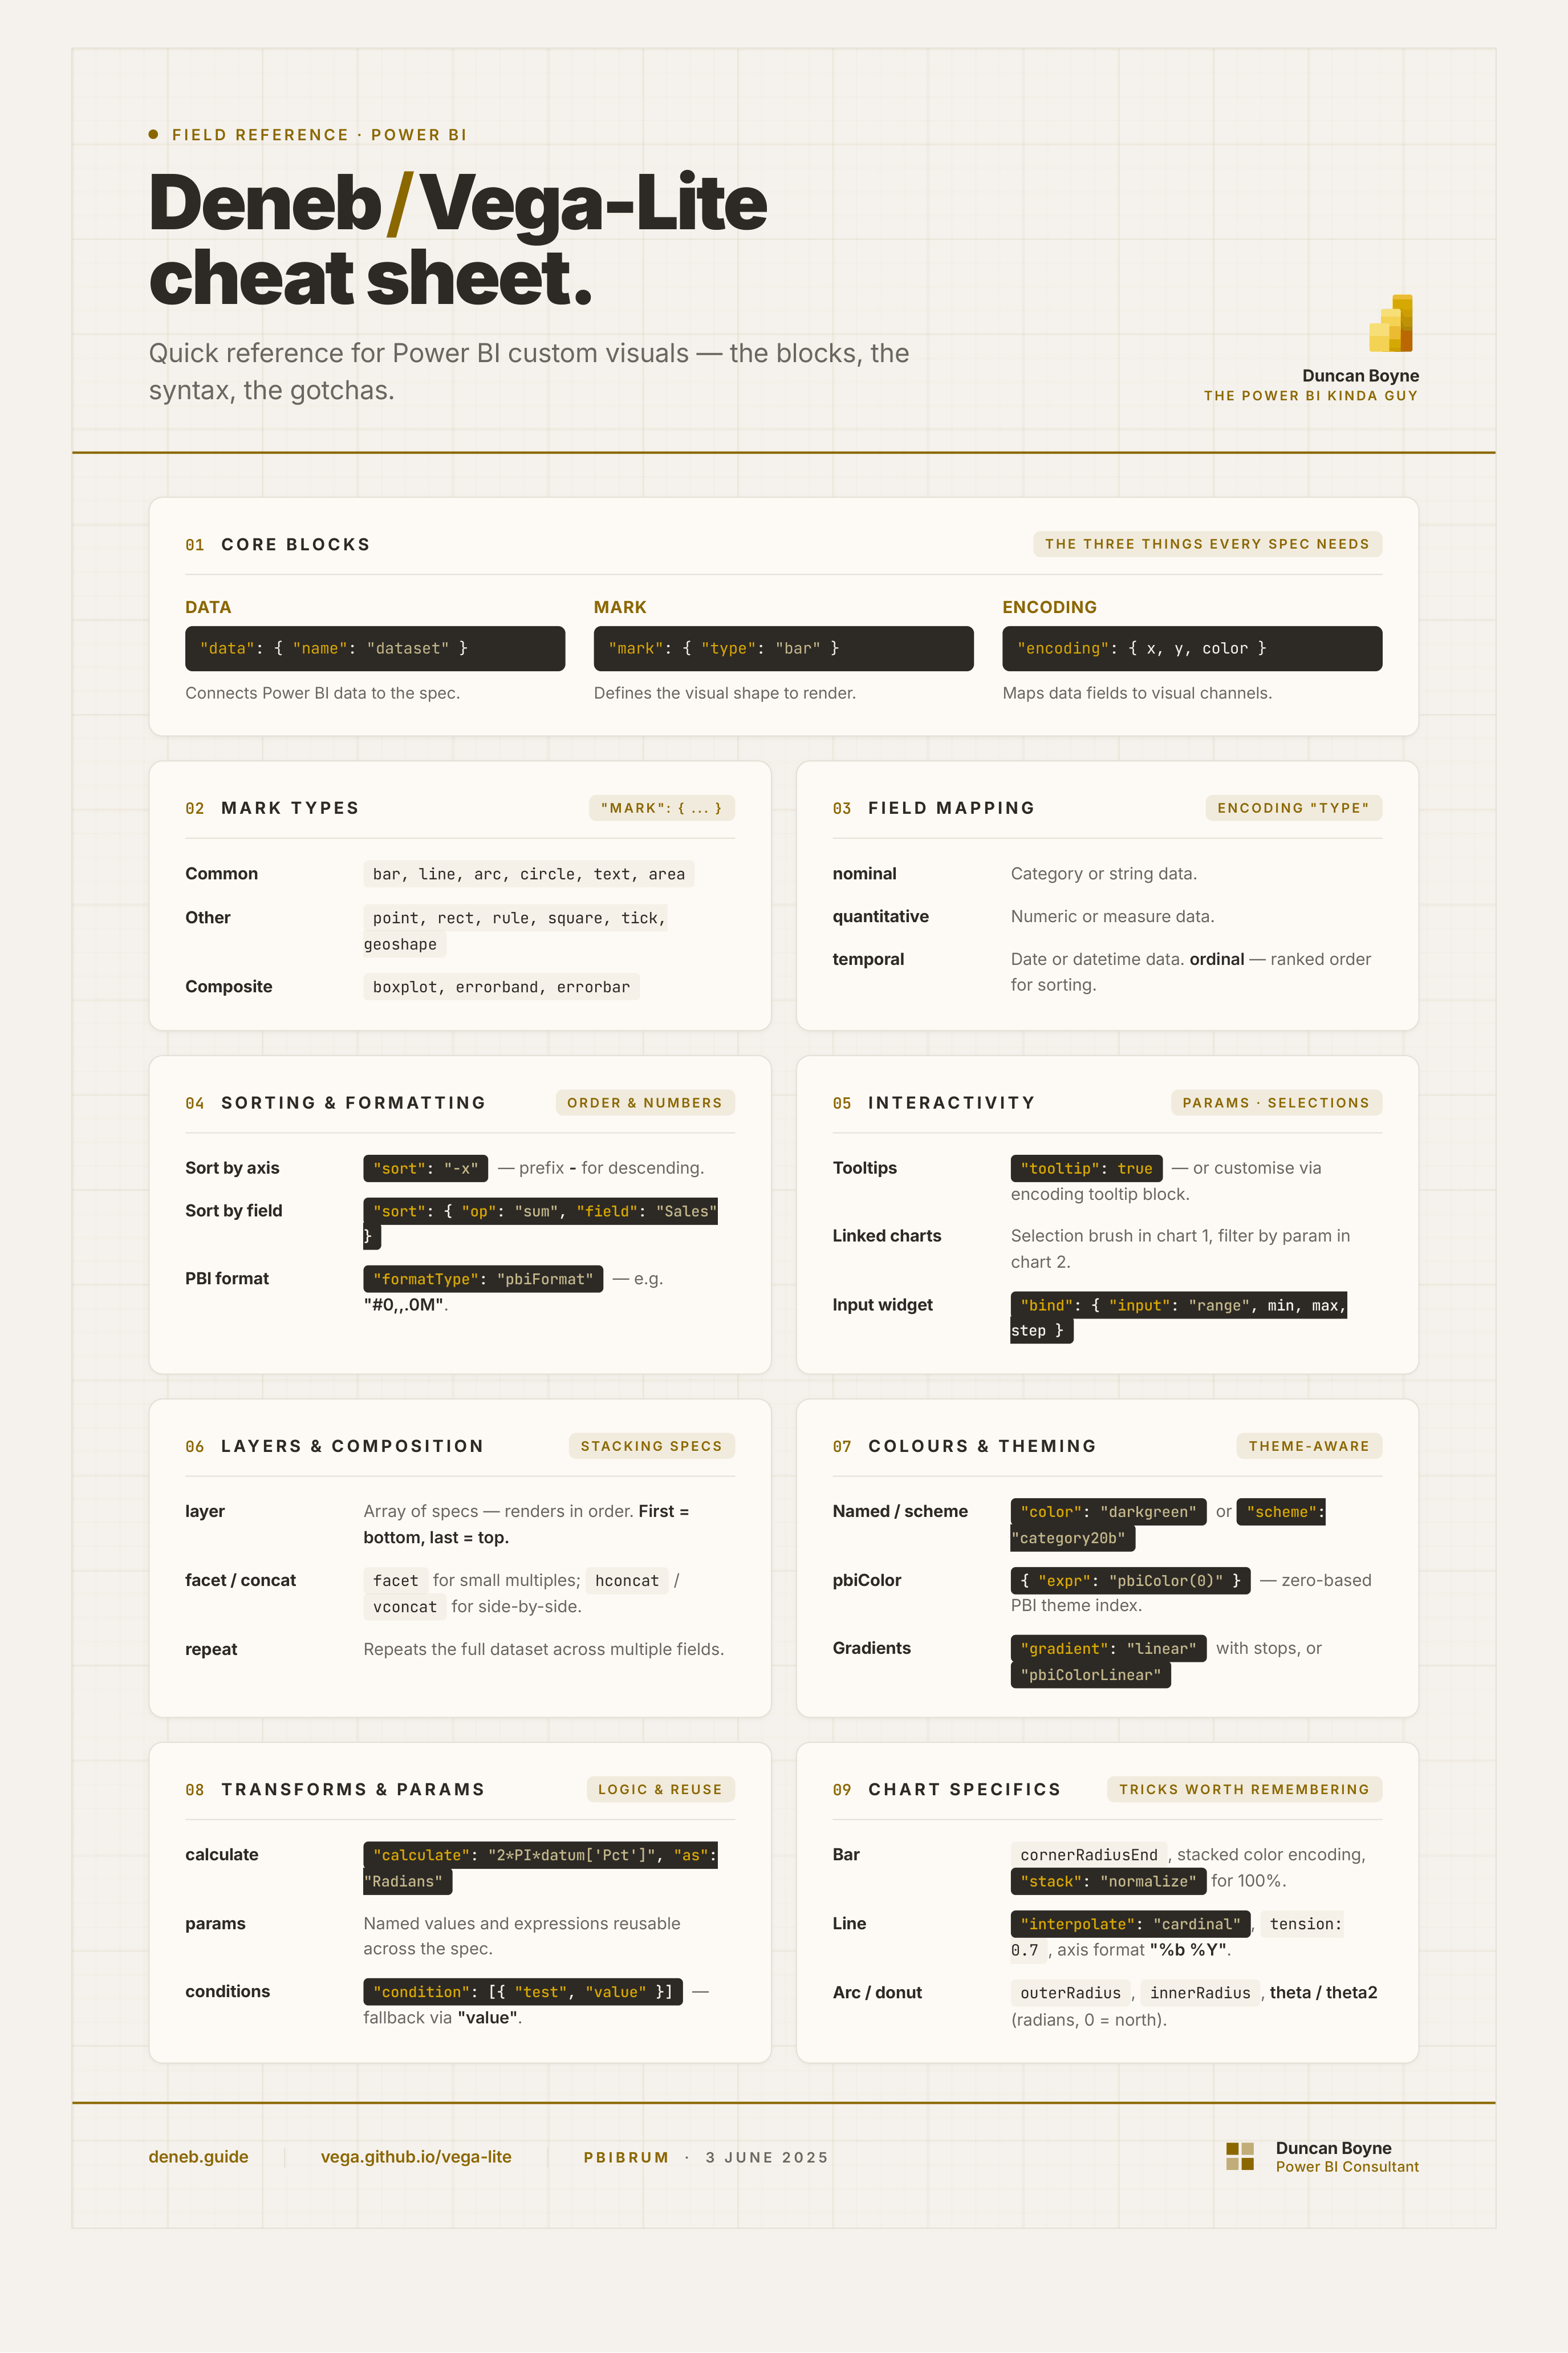
The Deneb / Vega-Lite Cheat Sheet I Kept Wishing Existed
A single reference for the Deneb / Vega-Lite things I reach for most often — the blocks, the syntax, and the gotchas. Built while preparing my PBIBRUM talk.
Is Your Power BI Data Ready for Copilot? Ask It Thirty Questions First
Copilot does not fix a semantic model, it inherits one. Thirty real business questions with verified answers turns AI readiness from an opinion into a pass rate you can watch move, and surfaces the capacity cost before the bill does.
My AI Adoption Was Immediate. Except in Power BI.
I was an early AI adopter everywhere — except in Power BI, my actual job. Here's why AI can read your data, but still can't tell you why the numbers are wrong.
Six Reports, Six Different Revenue Numbers
When every report is technically live and none of them agree, it is rarely a Power BI problem. How to work out which number is right in an afternoon: write the definition down first, then trace each report back to source.
SaaS Is Dead for Small Businesses but Surging for Enterprises
Vibe coding isn't replacing enterprise software — it's filling the gap for small businesses who can't afford £8k ticketing systems. Here's why the distinction matters.
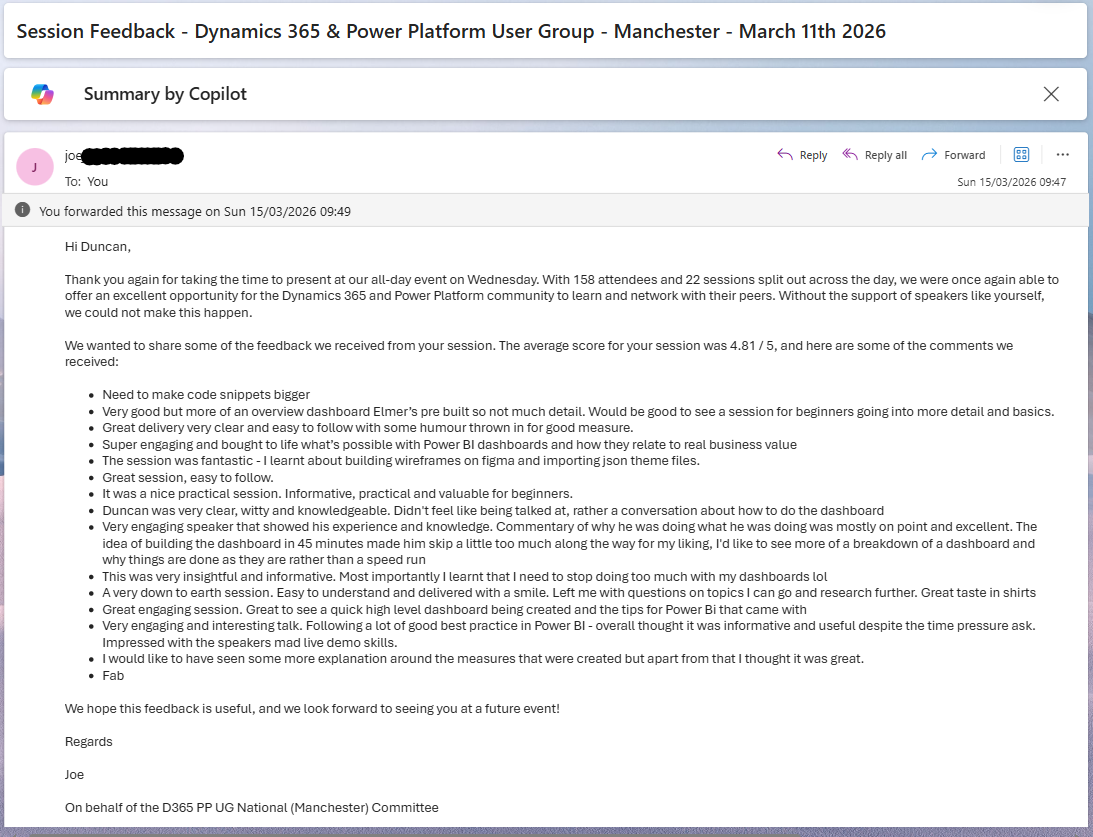
Speaker Feedback – D365 & Power Platform User Group Manchester
I received my first proper anonymous session feedback yesterday. 4.81 out of 5. Here is what people said, what I am taking away from it, and why "Fab" might be my favourite review of all time.

The Accidental Quest to Become a Modern Polymath
I was laid in bed at 2am watching YouTube Shorts when I started thinking about something slightly dangerous. What if I actually tried to become a modern polymath?
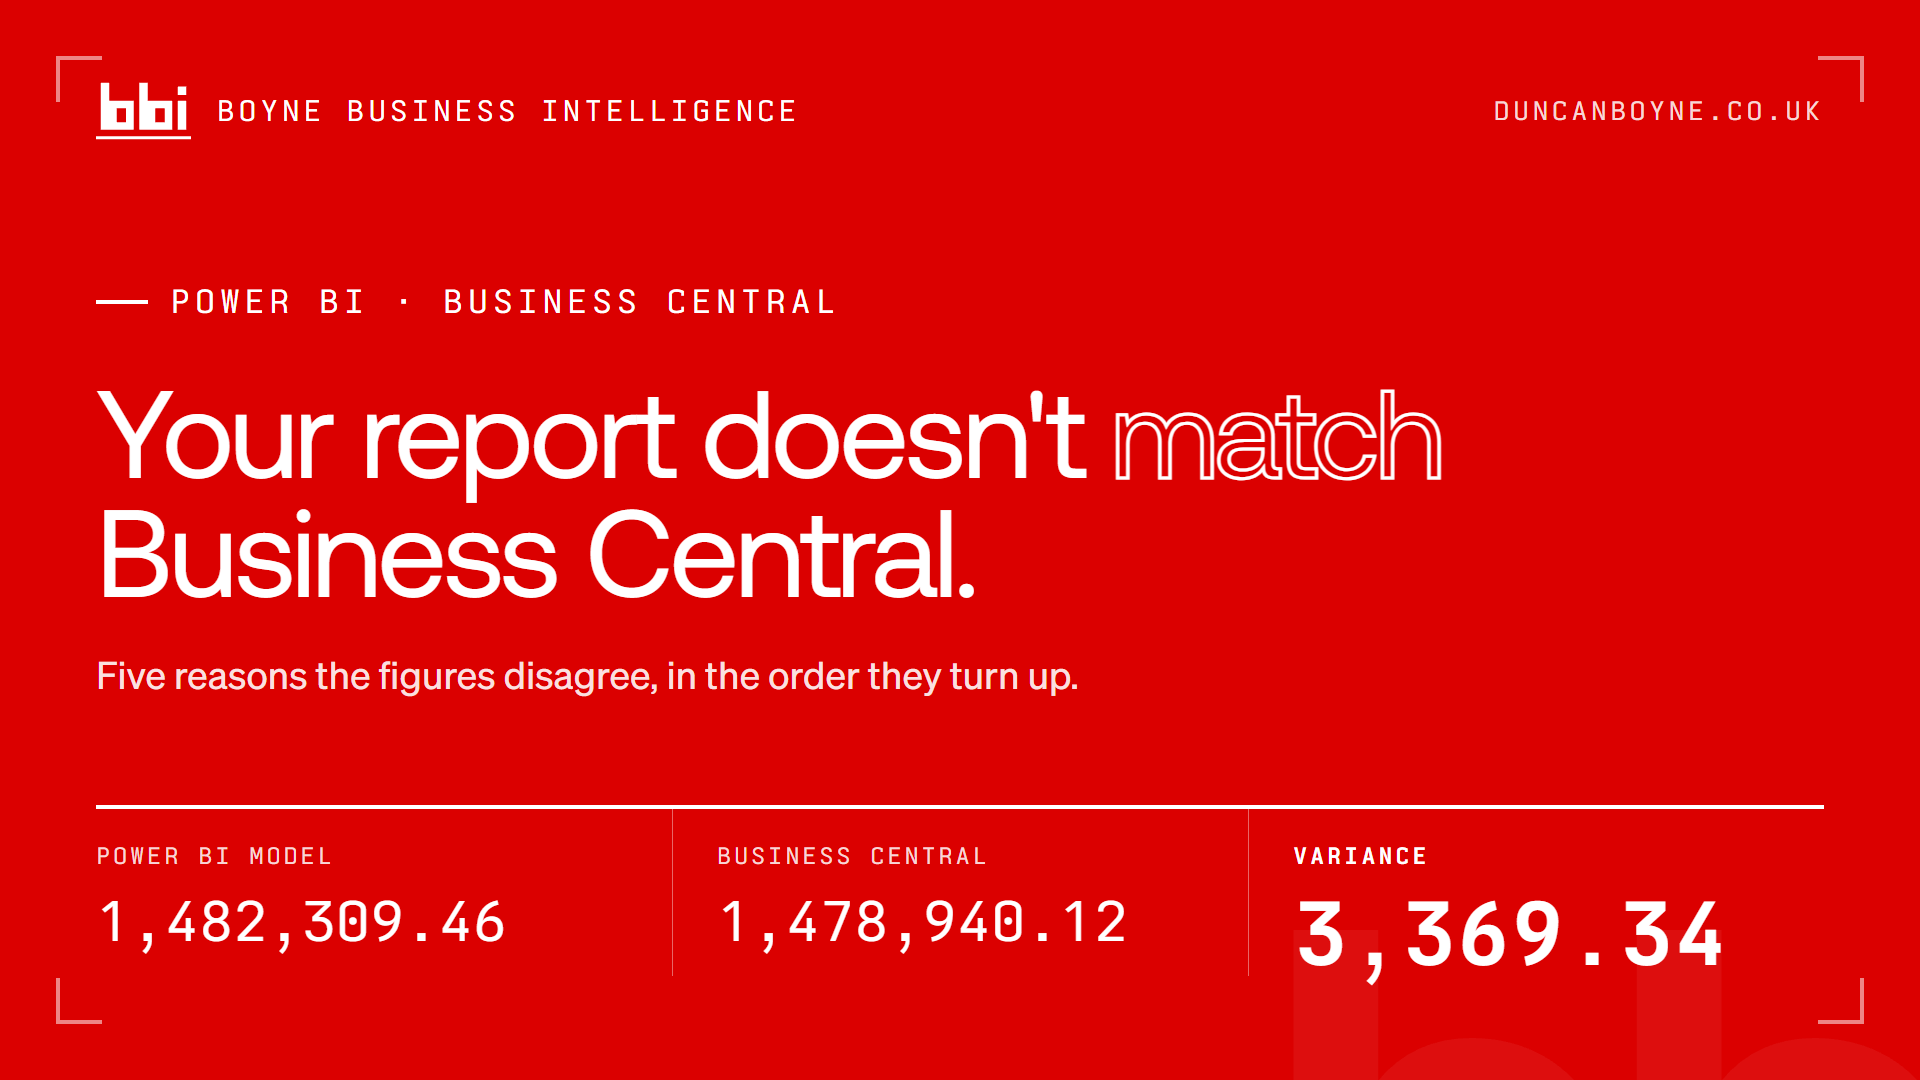
Why Your Power BI Report Doesn't Match Business Central
Five reasons a Power BI figure disagrees with Dynamics 365 Business Central, in the order they turn up: document date versus posting date, the sign on income accounts, unposted orders counted as sales, Amount versus Amount (LCY), and scope. Plus the one check that ends the argument permanently.
Steal My Website
Fork it. Clone it. Break it. Make it yours. Here's how I built my site and how you can steal it.
I Cried Today
Being alive is not a small thing. Some days, it's everything.
Claude Code Has Changed My Life
Claude Code, creativity, speed, and the reality of turning ideas into production in hours, not months.
Reasons to Stay
Content warning: suicide and mental health. A letter to a stranger about reasons to stay, reasons to exist, and reasons to endure.
This Is a Power BI Report I Actually Want to Open (Part 1)
Why most personal dashboards don't last, and why motivation matters more than measures ever will. Part 1 of building a Power BI report I actually want to open.