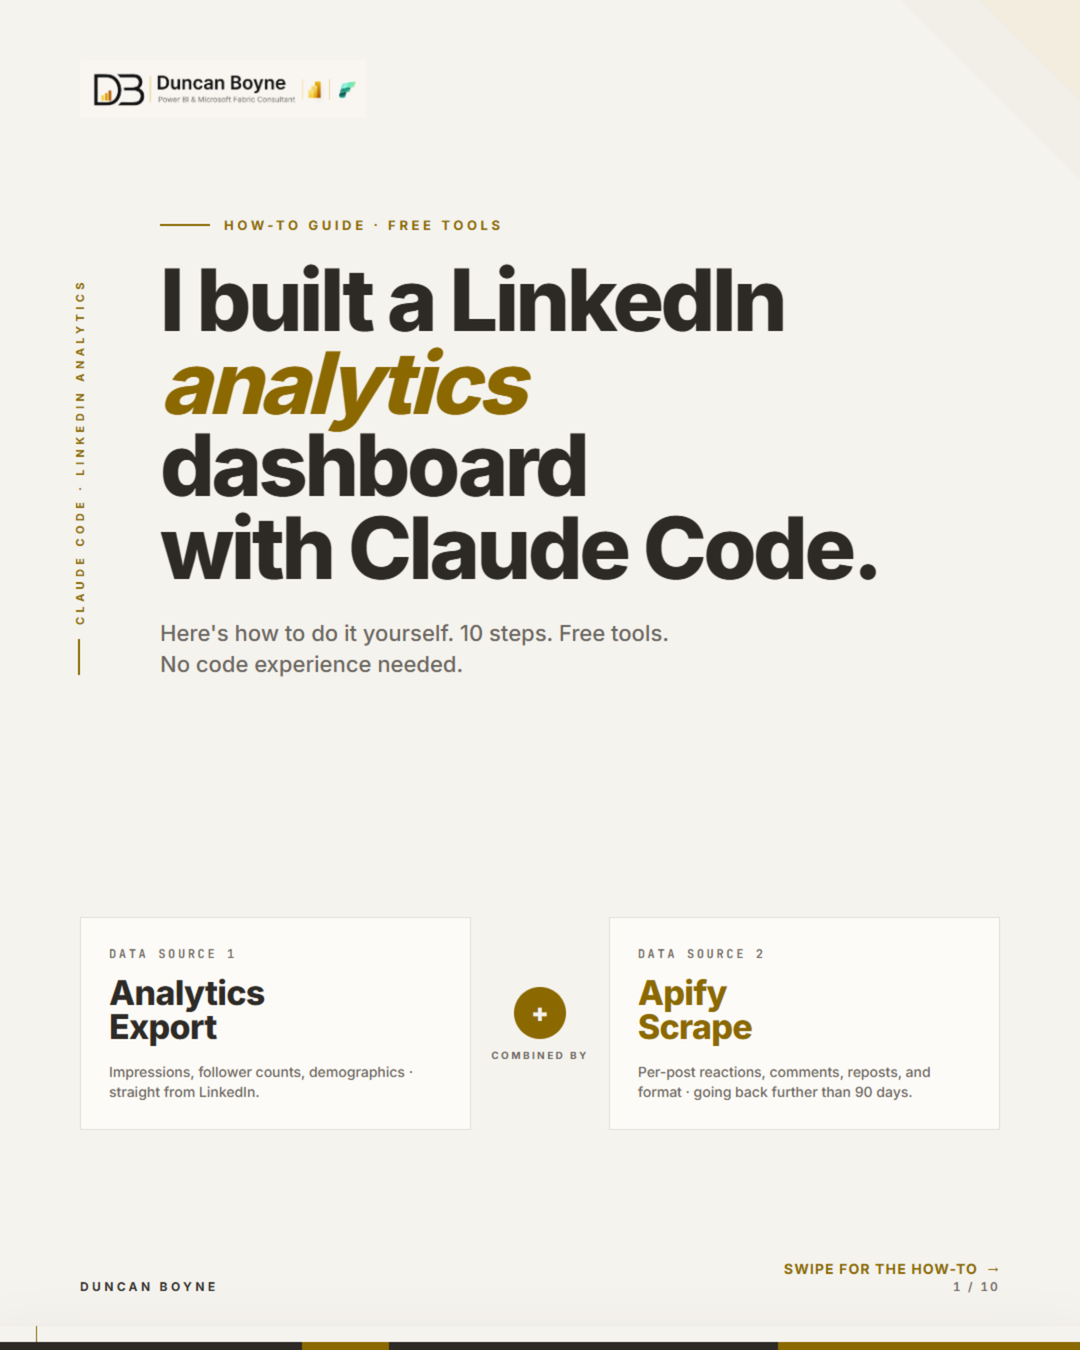
LinkedIn's analytics give you 90 days of data. That's not nothing. But it's not enough to see patterns.
After 18 months of posting, I wanted to know things the export couldn't tell me. Which content format actually performs better over time, not just last quarter. Whether the days I post matter. What my audience looks like at the seniority and industry level. And whether my best posts by impressions are the same ones as my best posts by engagement. (They're not. That turned out to be interesting.)
So I built a dashboard. And then I turned it into a Claude Code skill anyone can use.
The problem with LinkedIn's native analytics
LinkedIn's analytics page gives you:
- Impressions and reach for the last 30, 60, or 90 days
- A top posts list capped at 50
- Demographics: job titles, industries, seniority, company size, locations
- Follower counts with daily new follower data
What it does not give you:
- More than 90 days of history in a single export
- Per-post reaction breakdown (like, love, celebrate, insight counted separately)
- Content format comparison across your full history
- Any way to see which days of the week your posts actually land
The export button produces an xlsx file. It's useful. But if you've been posting for longer than 90 days, you need multiple exports to cover your full history. And even then, the reaction breakdown doesn't exist anywhere in LinkedIn's data.
The two data sources you need
The dashboard combines two exports. Each covers what the other misses.
| Source | What it provides |
|---|---|
| LinkedIn Analytics export (xlsx) | Impressions, reach, follower counts, demographics, top posts by impressions and engagements |
| Apify posts scrape (JSON) | Per-post reactions by type, comments, reposts, content format, post text |
Neither is complete on its own. Together, they cover the full picture.
Getting your Apify posts export
Apify is a web scraping platform. The free tier is enough for one scrape. You want the curious_coder/linkedin-post-scraper actor.
- Go to apify.com and create a free account
- In the Actor Store, search for
curious_coder/linkedin-post-scraper - Paste your LinkedIn profile URL in the actor settings
- Set Max posts to 300 or more to capture your full history
- Run the actor — it takes 2 to 5 minutes
- When complete, click Export, choose JSON, and download the file
The JSON contains one object per post. The fields the skill uses are under stats:
{
  "posted_at": { "date": "2025-08-14" },
  "post_type": "original",
  "text": "DAX has a reputation for being hard...",
  "url": "https://www.linkedin.com/feed/update/urn:li:activity:...",
  "stats": {
    "total_reactions": 47,
    "like": 31,
    "love": 8,
    "celebrate": 5,
    "insight": 3,
    "comments": 12,
    "reposts": 4
  },
  "media": { "type": "image" }
}
The skill filters out reposts automatically. Only original posts are analysed.
Getting your LinkedIn Analytics exports
Go to linkedin.com/analytics/creator. You need to be a creator or have a business page.
LinkedIn's export covers a maximum of 90 days per file. To get your full history, you export in chunks.
- Set the date range to the last 90 days and click Export
- Move the range back 90 days and export again
- Keep going until you've covered your full posting history
Each file downloads as Content_STARTDATE_ENDDATE_YourName.xlsx. Drop all of them into your project folder. The skill handles deduplication — where date ranges overlap, it keeps the higher value.
The xlsx contains five sheets:
| Sheet | Contents |
|---|---|
| DISCOVERY | Overall impressions and reach |
| ENGAGEMENT | Daily impressions and engagements |
| FOLLOWERS | Daily new followers and total count snapshots |
| TOP POSTS | Top 50 posts by engagements and by impressions |
| DEMOGRAPHICS | Job titles, industries, seniority, company size, locations |
Installing the Claude Code skill
The skill lives in your Claude Code skills folder. Installation takes two minutes.
Mac / Linux:
mkdir -p ~/.claude/skills/linkedin-dashboard
curl -o ~/.claude/skills/linkedin-dashboard/SKILL.md \
  https://raw.githubusercontent.com/DuncanBoyneJnr/linkedin-dashboard-skill/main/SKILL.md
Windows (PowerShell):
New-Item -ItemType Directory -Force "$env:USERPROFILE\.claude\skills\linkedin-dashboard"
Invoke-WebRequest `
  -Uri "https://raw.githubusercontent.com/DuncanBoyneJnr/linkedin-dashboard-skill/main/SKILL.md" `
  -OutFile "$env:USERPROFILE\.claude\skills\linkedin-dashboard\SKILL.md"
Restart Claude Code. Open a project folder containing your data files and say "linkedin dashboard".
You also need Python 3 with openpyxl and Node.js installed.
pip install openpyxl
What the skill actually does
When you trigger the skill, Claude works through a pipeline in three stages.
Stage 1: Extract and merge the xlsx data
A Python script reads every Content_*.xlsx file in the folder and merges:
- Daily engagement data across all files, using date as the key and keeping the higher value where ranges overlap
- Follower data, anchored to the known total from the most recent snapshot and reconstructed backwards and forwards from daily new follower counts
- Top posts, merged by URL with the highest engagement and impression values kept
Output: analytics_data.json and analytics_full.json
Stage 2: Process the Apify posts JSON
The Apify file is parsed. Reposts are filtered out. For each original post, the script extracts date, day of week, reactions by type, comments, reposts, content format, and the first 100 characters of post text.
Aggregates are computed by day of week and by content format.
Output: scatter_compact.json — a compact array-of-arrays format to keep the file size manageable inside the HTML.
Stage 3: Generate the dashboard
A Node.js script reads both JSON files and four inlined chart library files (React, ReactDOM, PropTypes, Recharts) and writes a single self-contained dashboard.html. No internet connection required after generation. No server. Open the file in Chrome.
What the dashboard shows
Headline cards: total impressions, total engagements, current follower count, new followers gained, average daily impressions, average engagement rate, total posts tracked
Monthly trend (three tabs): impressions and engagements, engagement rate per month, new followers per month
Follower growth: weekly cumulative total as an area chart, new followers per week as bars, dual y-axis
Day-of-week performance: average reactions and average engagements per post by day, built from the Apify data
Content format comparison: average reactions, average engagements, and post count by format across image, carousel, video, article, and text
Post scatter plot: every top post plotted by impressions (x-axis) and engagements (y-axis), divided into four quadrants based on the median values
| Quadrant | What it means |
|---|---|
| Stars | High impressions and high engagements — your best posts |
| Viral-Shallow | High impressions, low engagements — reached people who didn't engage |
| Niche-Gold | Low impressions, high engagements — resonated deeply with a specific audience |
| Underperformers | Low impressions, low engagements — didn't land |
Demographics: horizontal bar charts for job titles, industries, seniority, company size, and locations
Top 10 posts table: date, impressions, engagements, engagement rate, quadrant label, and a clickable link to each post
After the dashboard, Claude writes a strategic analysis covering performance trajectory, follower growth, top post patterns, audience profile, content format verdict, and 5 specific content recommendations tied to your data and your stated goals.
A note on the follower reconstruction
This part involved a small problem worth naming.
LinkedIn's follower count snapshots appear in the xlsx as text strings inside a header cell — something like "Total followers on 8/21/2025: 5086". They're not in a data column. The Python script extracts them with a regex, anchors the cumulative total on the earliest known snapshot, and reconstructs the series backwards and forwards from the daily new follower data.
If your oldest file doesn't have a snapshot near the start of your history, the earliest follower counts in the chart are estimates. The more files you have, the more accurate the reconstruction. The script flags where the estimate begins.
Resources
- github.com/DuncanBoyneJnr/linkedin-dashboard-skill — the skill file, README, and installation instructions
- apify.com — the scraping platform used for the posts export
- linkedin.com/analytics/creator — where to export your Analytics data
- recharts.org — the charting library the dashboard uses