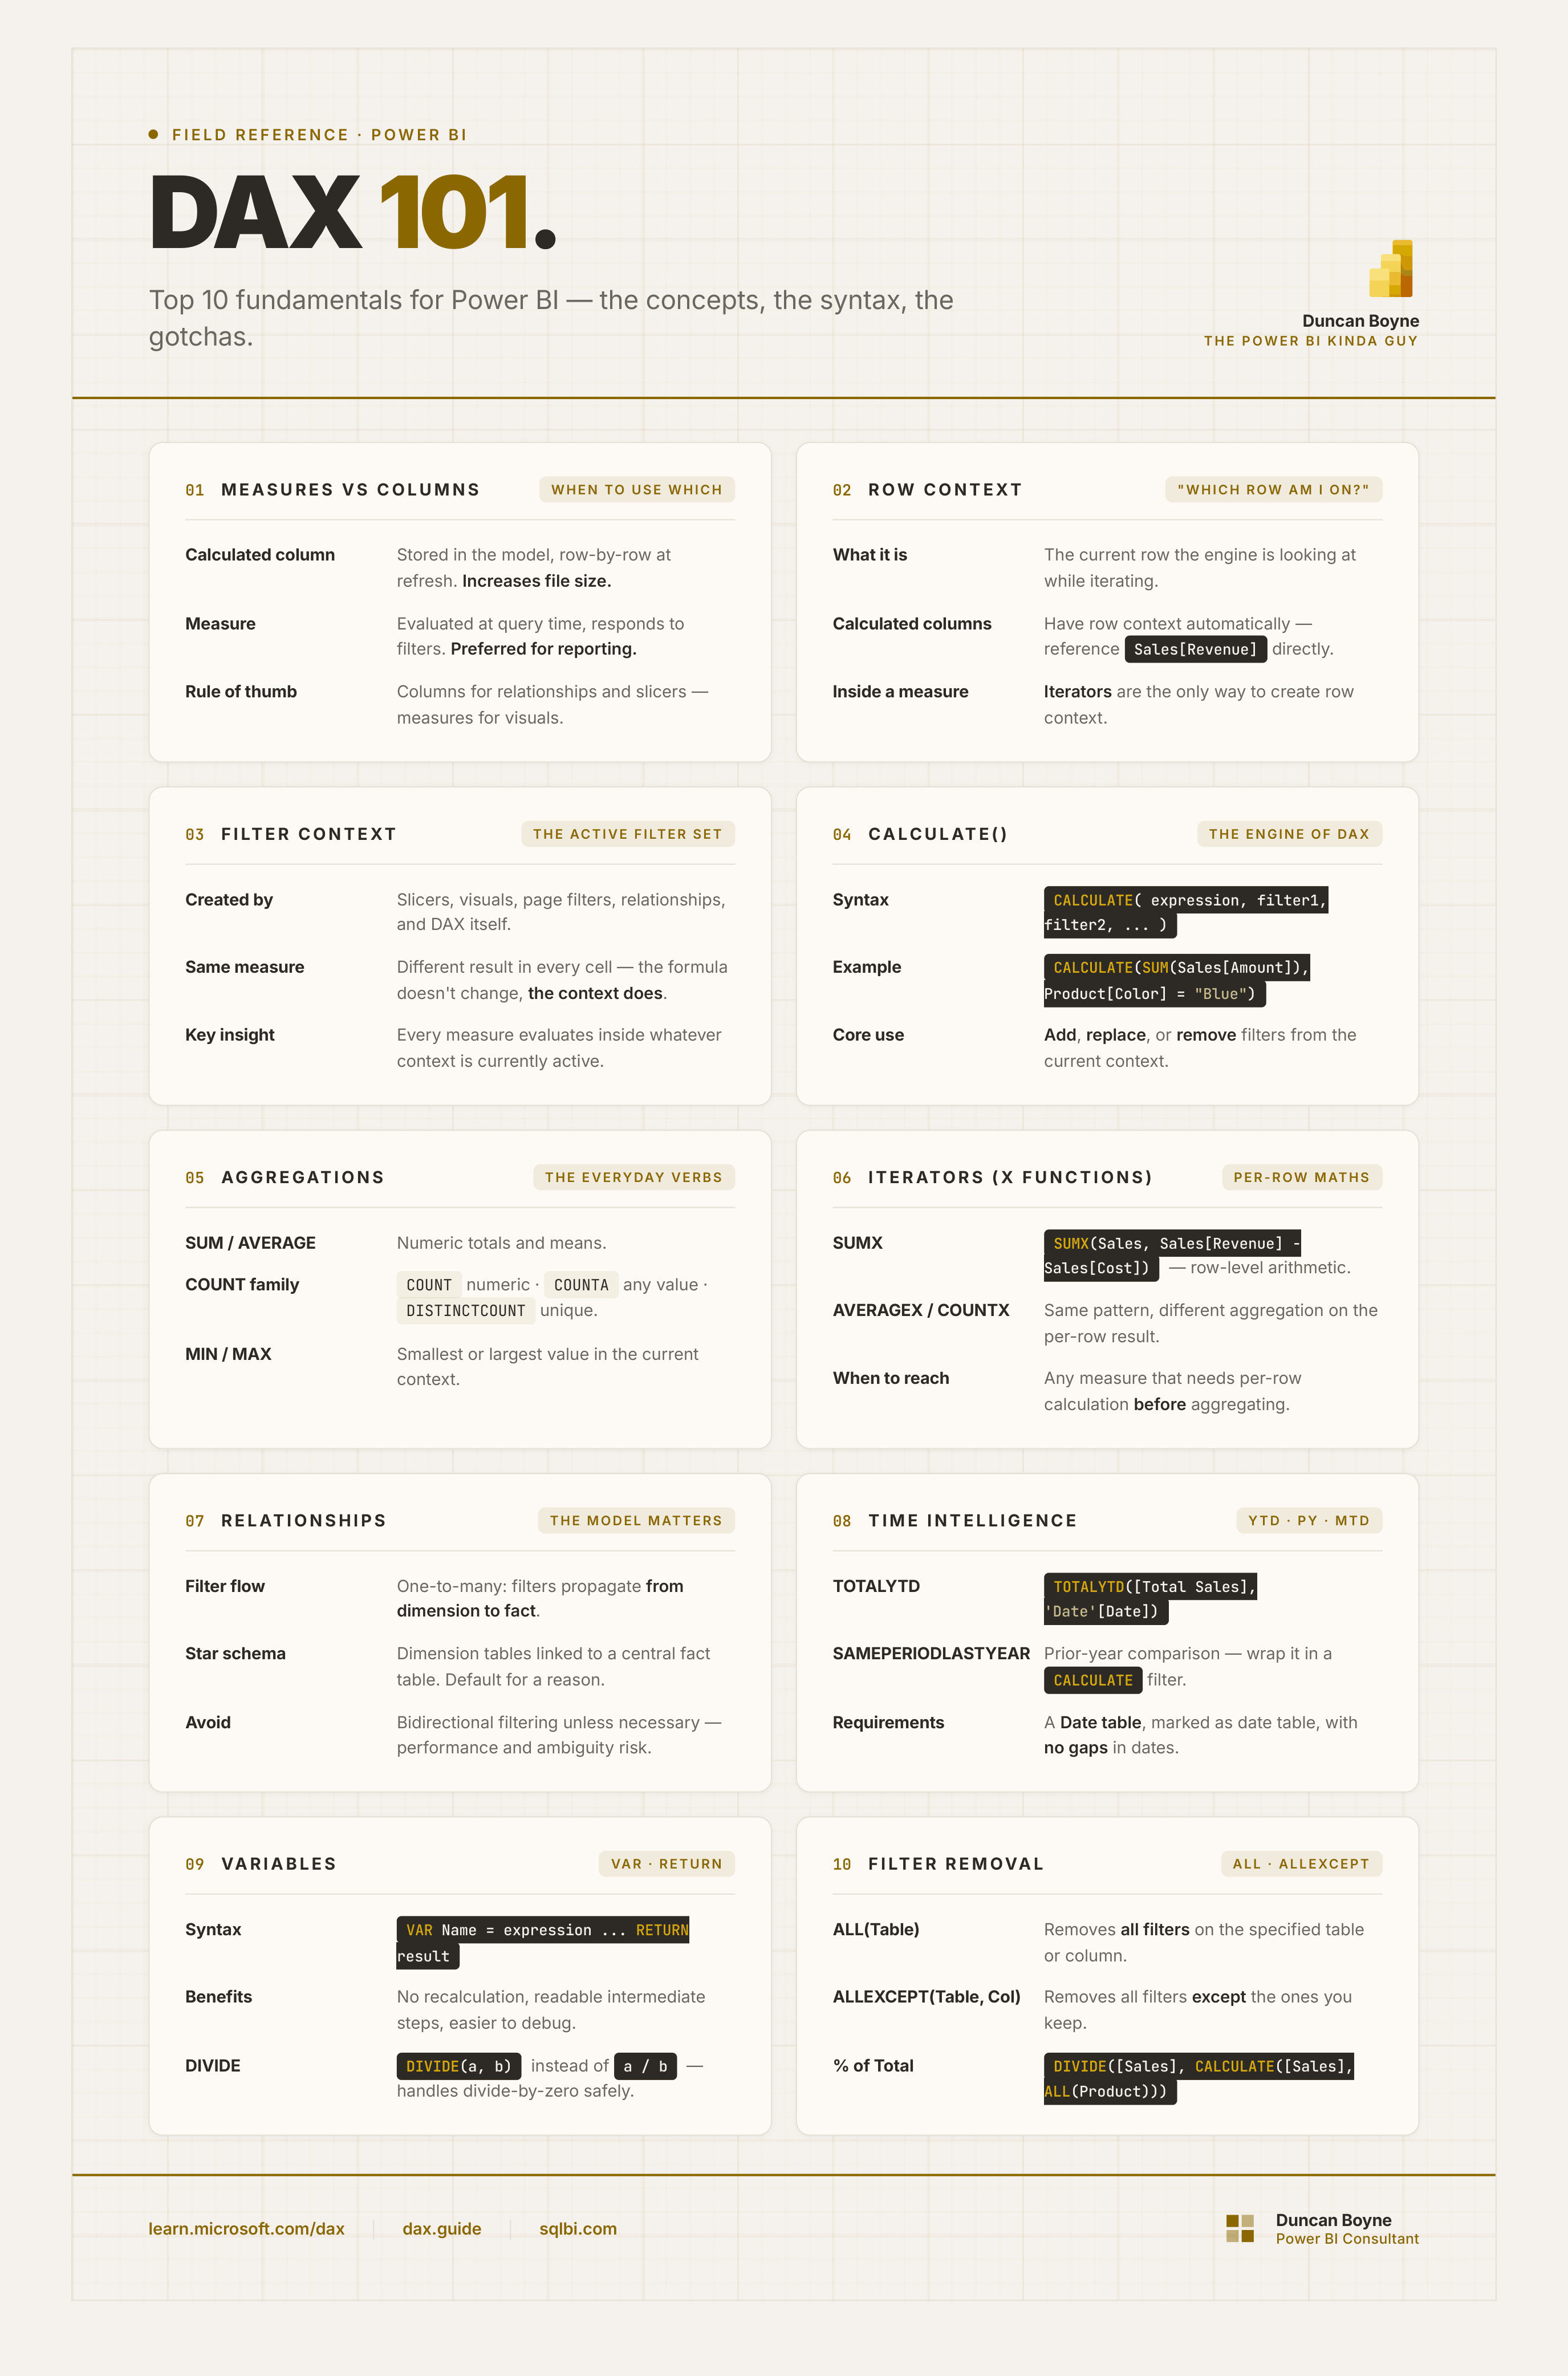
DAX has a reputation for being hard. It is not hard. But it is different.
The problem most people hit is that DAX looks like Excel formulas, so they try to learn it like Excel formulas. It is not. It is a query language built around data models. Once that clicks, everything else follows faster.
This is the 10 things I would teach someone starting from scratch. Not the full language. The concepts that unlock the rest of it.
1. Measures vs Calculated Columns
This is the first thing to get right, and the most commonly confused.
A calculated column is computed row by row during refresh and stored in the model. It exists in the table like any other column.
A measure is computed at query time, in response to whatever filters are active. It is not stored anywhere. It is recalculated every time it is used.
-- Calculated column (lives in the table, refreshed with data)
Profit = Sales[Revenue] - Sales[Cost]

-- Measure (calculated on demand, responds to filters)
Total Sales = SUM(Sales[SalesAmount])
In practice: use calculated columns when you need a value to exist per row for use in a relationship or a slicer. Use measures for everything you display in a visual.
Model size, performance, and behaviour all depend on getting this distinction right.
Full reference: learn.microsoft.com/en-us/dax/dax-overview
2. Row Context
Row context is the answer to: "what row am I currently looking at?"
Calculated columns always have row context. DAX knows which row it is evaluating, and you can reference column values on that row directly.
Profit = Sales[Revenue] - Sales[Cost]
Each row calculates its own profit. The column values change per row. That is row context.
Measures do not automatically have row context. This is why you cannot write SUM(Sales[Revenue] - Sales[Cost]) and expect it to work the way a calculated column would. You need an iterator to create row context inside a measure.
3. Filter Context
If row context is the most important concept for calculated columns, filter context is the most important concept for measures.
Every measure you write is evaluated inside a filter context. That context is created by:
- Slicers on the page
- Filters on the visual
- Row and column headers in a matrix or table
- Page-level and report-level filters
- Relationships in the model
- DAX itself (via
CALCULATE)
This is why the same measure can return different values in different places. The measure is not changing. The filter context is.
Total Sales = SUM(Sales[SalesAmount])
This measure will return the total for the UK if a slicer is set to UK. It will return the total for 2024 if a year filter is active. The formula is identical in both cases.
Understanding filter context changes how you read DAX. The formula is not a calculation. It is a calculation given the current context.
4. CALCULATE()
CALCULATE is the most important function in DAX. It evaluates a measure in a modified filter context.
Blue Sales =
CALCULATE(
    SUM(Sales[SalesAmount]),
    Product[Color] = "Blue"
)
This measure returns total sales, but with an additional filter applied: only blue products. Whatever else is filtered in the visual, the product colour is overridden to blue.
CALCULATE can add filters, remove filters, or replace them entirely. It is how you build measures that ignore slicers, calculate totals, compare periods, and almost anything else that requires context manipulation.
If you truly understand CALCULATE, you understand the core of DAX. Most advanced DAX is a variation on this one function.
Full reference: learn.microsoft.com/en-us/dax/calculate-function-dax
5. Aggregation Functions
These are the building blocks. You need all of them.
| Function | What it does |
|---|---|
SUM |
Adds numeric values |
AVERAGE |
Calculates the mean |
COUNT |
Counts rows with a numeric value |
COUNTA |
Counts rows with any non-blank value |
DISTINCTCOUNT |
Counts unique values |
MIN / MAX |
Returns the smallest or largest value |
Customer Count = DISTINCTCOUNT(Sales[CustomerID])

Average Order Value = AVERAGE(Sales[SalesAmount])
These all operate in the current filter context. DISTINCTCOUNT is the one most people reach for later than they should — it is useful constantly.
Full reference: learn.microsoft.com/en-us/dax/aggregation-functions-dax
6. Iterator Functions (The X Functions)
This is where row context and filter context come together.
Iterator functions — SUMX, AVERAGEX, COUNTX, MAXX, MINX — take a table and an expression. They iterate over every row in that table, evaluate the expression in row context, then aggregate the results.
Total Profit =
SUMX(
    Sales,
    Sales[Revenue] - Sales[Cost]
)
This iterates every row in the Sales table. For each row, it calculates Revenue - Cost. Then it sums all those results.
This is the correct way to do row-level arithmetic inside a measure. It creates row context during the iteration, which plain SUM does not.
Most intermediate DAX problems — weighted averages, dynamic margins, conditional totals — are solved with iterators.
Full reference: learn.microsoft.com/en-us/dax/sumx-function-dax
7. Relationships and Filter Propagation
DAX does not work in isolation. It works through the data model.
When you filter a visual by product colour, that filter propagates through the relationship from the Product table to the Sales table. Your measure on Sales automatically responds to it.
Understanding:
- One-to-many relationships — the standard. Filter flows from the one side to the many side.
- Filter direction — by default, filters flow one way. Bidirectional filtering exists but has performance implications and can produce unexpected results.
- Star schema design — dimension tables linked to a central fact table. This is the model structure DAX is optimised for.
Date ─────┐
Product ──┤──→ Sales (fact table)
Customer ─┘
A badly designed model makes good DAX hard. A well-designed model makes DAX feel natural.
Full reference: learn.microsoft.com/en-us/power-bi/guidance/star-schema
8. Time Intelligence
This is what makes Power BI useful for business reporting. Year-to-date, prior year comparisons, rolling averages — all of it depends on time intelligence functions.
Core functions:
Sales YTD =
TOTALYTD(
    [Total Sales],
    'Date'[Date]
)

Sales PY =
CALCULATE(
    [Total Sales],
    SAMEPERIODLASTYEAR('Date'[Date])
)

Sales vs PY =
CALCULATE(
    [Total Sales],
    DATEADD('Date'[Date], -1, YEAR)
)
For these to work, you need:
- A dedicated Date table with one row per day and no gaps
- The table marked as a Date table in Power BI
- A relationship from the Date table to your fact table on a date column
Skip any of those three and the functions will either break or return wrong results silently.
Full reference: learn.microsoft.com/en-us/dax/time-intelligence-functions-dax
9. Variables (VAR / RETURN)
Variables make DAX cleaner, faster to evaluate, and easier to debug.
Profit Margin =
VAR TotalProfit = [Total Profit]
VAR TotalRevenue = [Total Revenue]
RETURN
    DIVIDE(TotalProfit, TotalRevenue)
Without variables, you would calculate [Total Profit] and [Total Revenue] twice each if you used them in multiple places. Variables cache the result. They also let you name intermediate steps, which makes complex measures readable.
DIVIDE is the right function for division in DAX. It handles divide-by-zero gracefully, returning blank (or a value you specify) instead of an error.
Variables also help with debugging. Comment out the RETURN line and replace it with RETURN TotalProfit to inspect an intermediate value in the visual.
Full reference: learn.microsoft.com/en-us/dax/var-dax
10. Filter Removal Functions
To calculate a percentage of total, you need the filtered value and the unfiltered total. That requires removing filters.
% of Total =
DIVIDE(
    [Total Sales],
    CALCULATE(
        [Total Sales],
        ALL(Product)
    )
)
ALL(Product) removes all filters from the Product table. The inner CALCULATE then evaluates [Total Sales] as if no product filter exists — giving the grand total.
Key functions:
| Function | What it removes |
|---|---|
ALL(Table) |
All filters on the table |
ALL(Table[Column]) |
All filters on a specific column |
ALLEXCEPT(Table, Column) |
All filters except the ones you specify |
REMOVEFILTERS |
Same as ALL, more explicit syntax |
These are what make totals and percentages work correctly in complex reports.
Full reference: learn.microsoft.com/en-us/dax/all-function-dax
The Three Concepts That Matter Most
If I had to pick three things that unlock most of real-world DAX:
- Filter context — understanding what filters are active when a measure evaluates
- CALCULATE — the mechanism for changing that filter context
- Iterators — the way to create row context inside a measure
Those three cover about 80% of the problems people actually run into.
Recommended Learning Order
Most people try to learn DAX by memorising functions. That is the slow path. The fast path is understanding context first, then learning which functions manipulate it.
- Measures vs calculated columns
- Basic aggregations (
SUM,DISTINCTCOUNT, etc.) - Filter context
CALCULATE- Row context
- Iterators (
SUMX, etc.) - Relationships and filter propagation
- Time intelligence
- Variables
- Filter removal (
ALL,ALLEXCEPT)
Each concept builds on the previous one. Skipping ahead works until it does not.
Resources
- learn.microsoft.com/en-us/dax — the official DAX reference. Dense but complete.
- dax.guide — cleaner layout, with community notes and examples for each function
- sqlbi.com/articles — SQLBI's articles are the best free resource for understanding context deeply. Start with anything by Marco Russo or Alberto Ferrari on filter context.