Pumpkins here, pumpkins there, pumpkins were bloody everywhere!
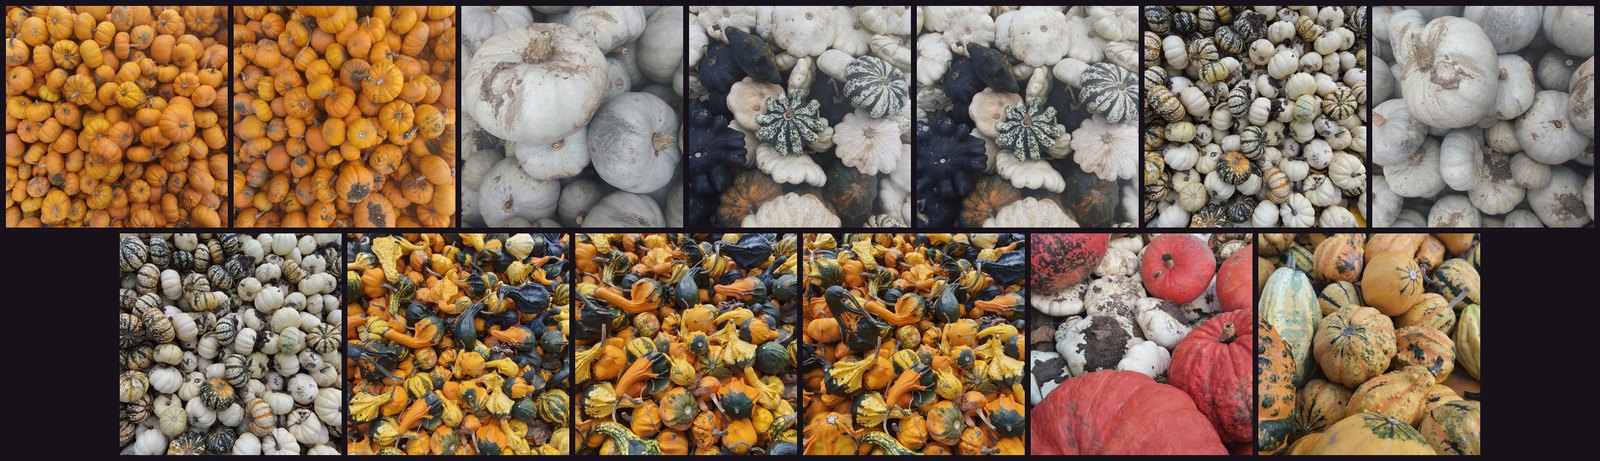
Well, that was kinda the point. Me and my family were at a pick-your-own pumpkin farm, but the ones out front, all the little ones stacked up, got me thinking. And taking a few too many photos.
Little orange ones, blue-grey squash, flat white pattypans, stripy ones, gourds covered in warts, and a spiky yellow thing I later found out is called a Crown of Thorns. Thirteen photos in the end.
It reminded me of data (NERD ALERT MUCH?). I know I'm meant to be out with the family enjoying it, but I see things and my brain goes ooooh, that's pretty, let's make something of it.
The proof of concept
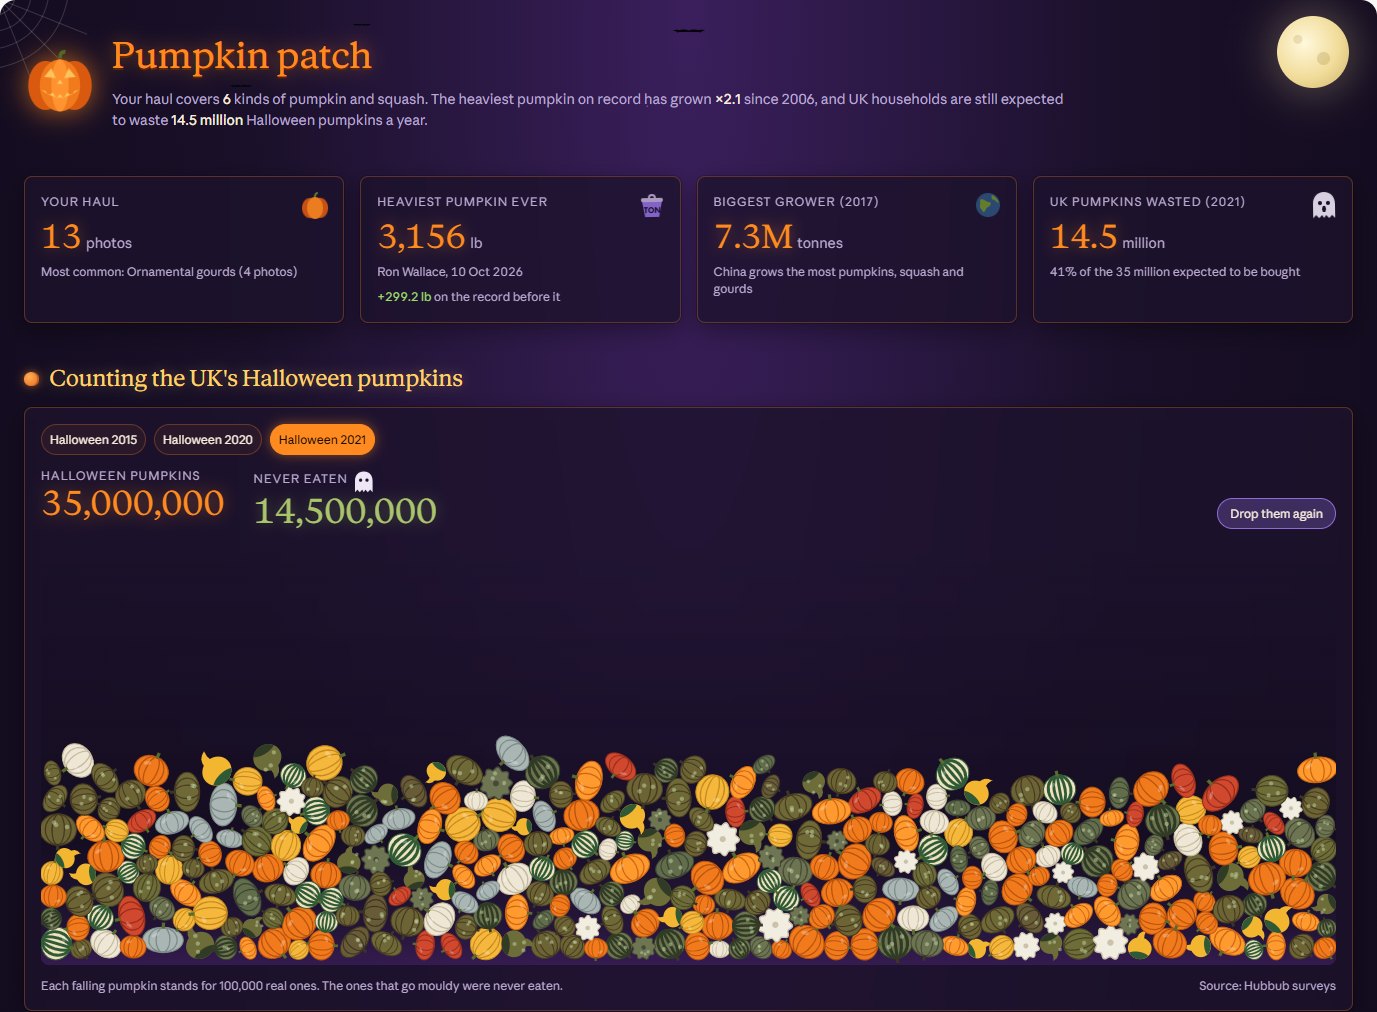
On the way home I gave all thirteen photos to Claude and had it make a dashboard, as a proof of concept. No brief beyond "pumpkins" and no spreadsheet.
It looked at each photo and had a guess at the variety (Rouge Vif d'Étampes, Crown Prince, Jack Be Little, Baby Boo, Sweet Dumpling and so on), worked out the average colour of each one from the pixels, and then went off and found data to go with them: the world record heaviest pumpkins from Guinness, how many Halloween pumpkins the UK buys and never eats from Hubbub's surveys, and which countries grow the most.
Funny thing is, the world record had changed twice that month. Ian Paton set it at 2,856.8 lb in Wargrave on 3 October, and a week later Ron Wallace beat it in Rhode Island with 3,156 lb.
What came back was a full dashboard. Night sky, a moon, bats, a flickering lantern. Pumpkins fall from the top of the screen and pile up, one for every 100,000 real ones, so 350 of them for 2021, and the ones that were never eaten turn green and grow mould. Tap any of my photos and you get a card for that variety: where it's from, what it tastes like, what it's good for, how long it keeps. And every number on the page can be clicked to show the sum and the file it came from.
Then a proper Power BI report
A proof of concept is a proof of concept, though. Once I got home I asked Claude Code to rebuild it as a proper Power BI report. Same five datasets, same colours, same sections, one 1920×1080 page, native visuals wherever one exists, and the same numbers to the decimal so the two could sit side by side.
It ended up as 7 tables, 47 measures and 18 visuals. Power BI doesn't do animation, so the falling pile became a still picture drawn by a DAX measure, one tiny pumpkin per 100,000 with the mouldy ones scattered through it. The moon, the bats and all the static text became a single background image, built as an HTML page and screenshotted. And the 20 countries wouldn't fit as a bar chart, because Power BI won't draw a bar much thinner than about 20 px and there were only 330 px to play with, so that became a table with little SVG bars in it.
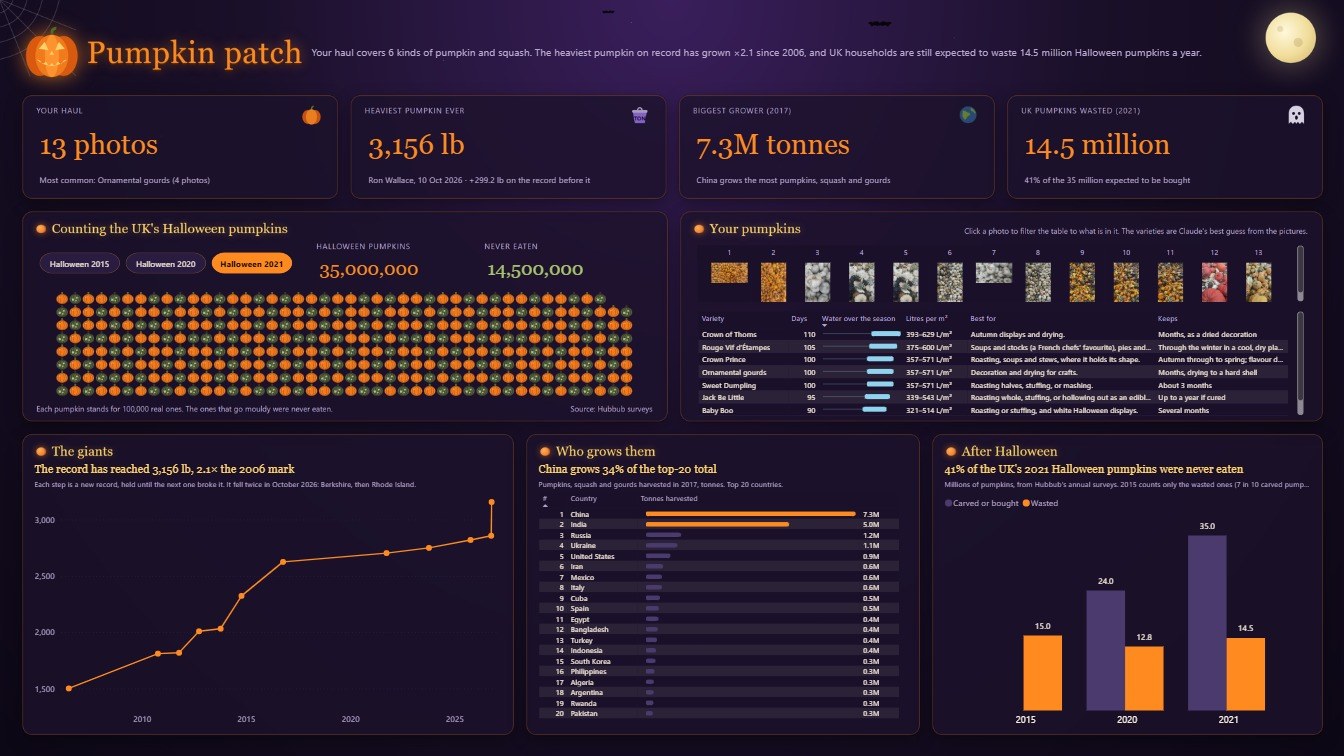
It wasn't clean, for the record. Seven rounds of screenshots between 17:13 and 17:27. The first one had invisible button text, numbers cut off top and bottom, the headline running under the moon, 9 of the 13 photos showing and 12 of the 20 countries. "UK's" lost its apostrophe because of a Python quirk ('UK''s' in Python is just two strings stuck together). At one point Power BI Desktop wouldn't close because Git Bash had mangled the command that was meant to close it. Fourteen minutes later it was all there.
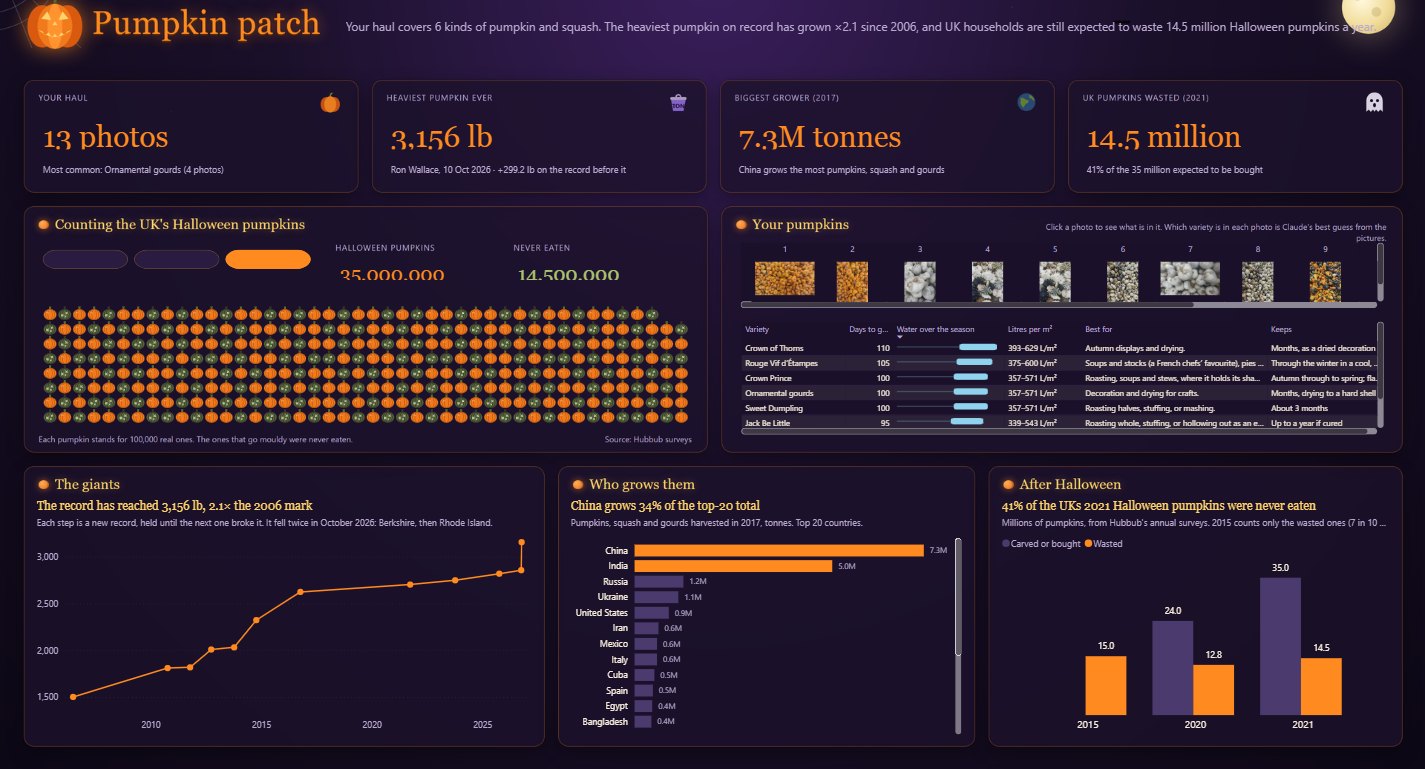
Putting the two next to each other was the interesting bit. The Claude page does things Power BI can't: stuff moves, the tooltips can be whatever you want, and anyone reading it can click a number and see where it came from. One prompt, one afternoon, nothing installed.
The Power BI page does things the Claude page can't. There's a proper semantic model underneath that Excel or any other report can reuse. Clicking a photo filters the variety table through a relationship, with no code. There's a theme file that restyles everything at once, and the whole thing is a .pbip that can go in git and publish to the Service with a refresh. The price is that every sentence with a number in it had to become a measure, and every bit of static text ended up baked into a background picture.
What if I taught it design?
This year I've been giving a talk called Good Design Wins Adoption. So I gave Claude my talk guide and asked it to build both again from scratch, in fresh files, using that methodology.
First go, it copied the example report from my slides. Layout, structure, the lot. My reply, typos tidied: "I wanted you to use the learnings, teaching and philosophy of the talk, not to copy the report design and structure of it (AWFUL, BORING AND MEH at best. Do better)."
Second go was different. It took the rules rather than the picture:
- One accent colour, used once per visual. Orange goes on the newest record, the 2021 bar and China's bar. Everything else is grey.
- 60-30-10 as a budget. Warm linen background, charcoal structure, pumpkin orange for the last 10%.
- Greyscale first. Take the colour away and you should still read it in the right order: the headline number, the two KPIs, the chart titles, the charts, then the detail.
- Titles are the answer, as a sentence. "The record has reached 3,156 lb, 2.1× the 2006 mark", not "Weight by Year".
- Every KPI gets a comparison and a direction, with an arrow and not just a colour. 41% of 2021's Halloween pumpkins never eaten, against 53% in 2020, ▼ 12 points.
Numbers get said in words as well. The 3,156 lb headline comes with "about the weight of a family hatchback."
And it had a list of things it refused to do: gauges, pies, dual axes, walls of cards, animation for its own sake, and Halloween props. So the bats, the moon, the lantern and my falling pile of mouldy pumpkins all went.
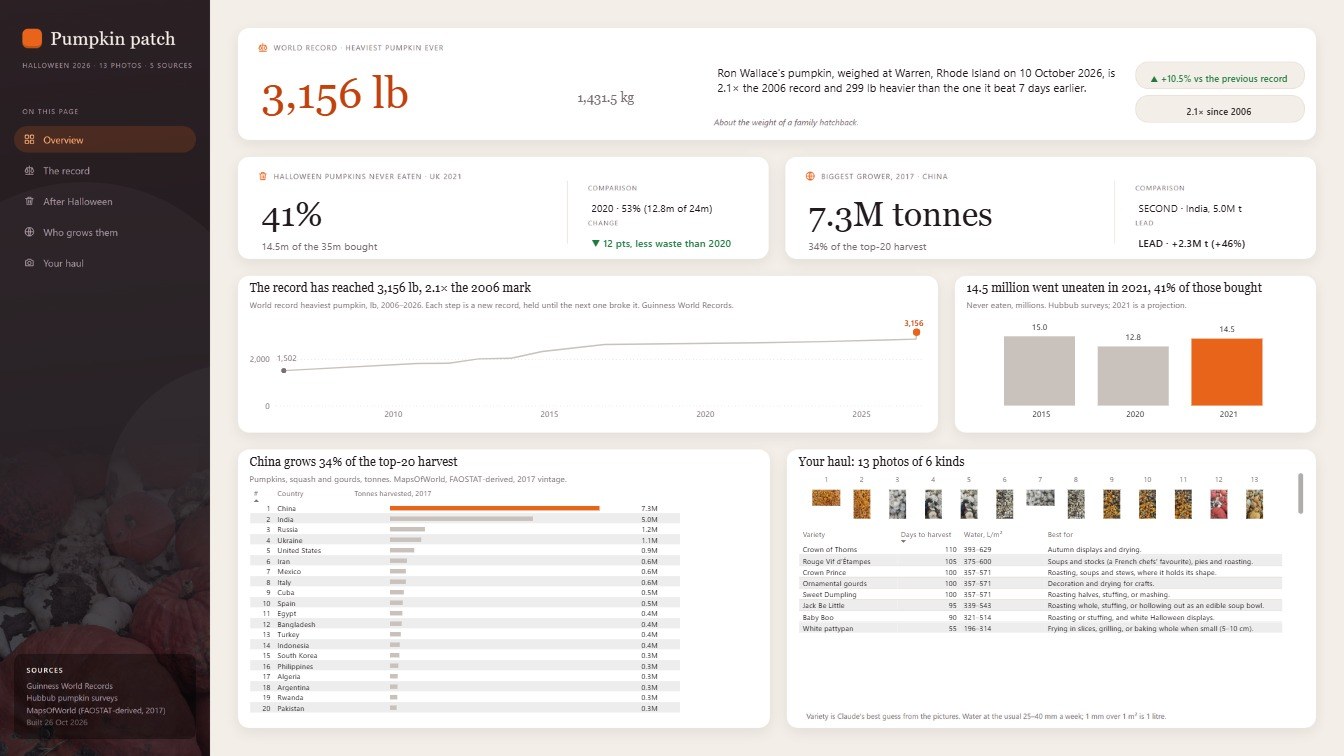
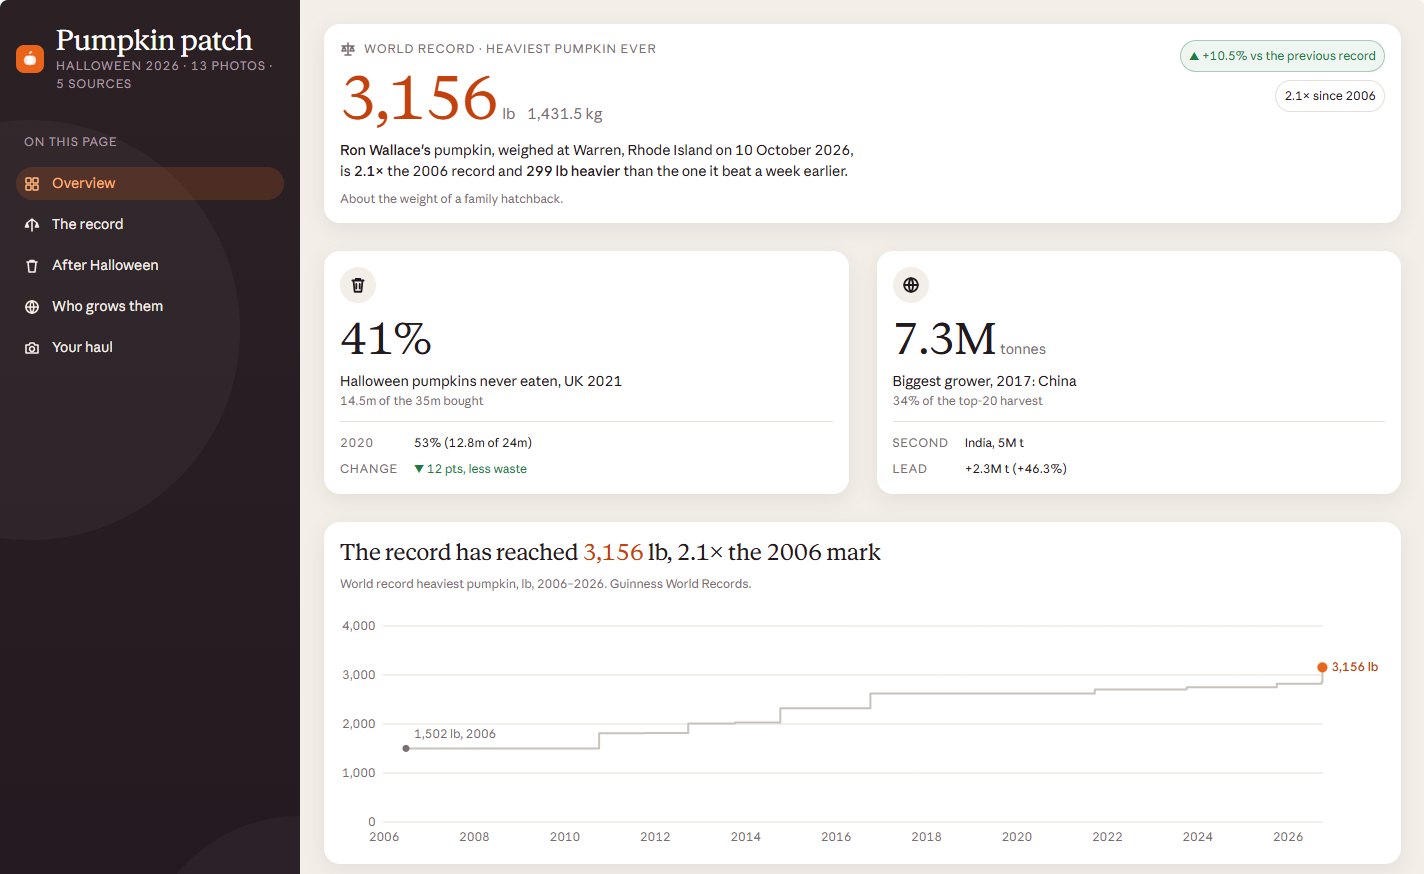
Halfway through I also sent it this: "You also need to learn that your text boxes cut words in half a lot as you don't format them correctly." Which they did. The new card visual in Power BI has about 20 px of fixed padding, so 11 pt text in a 27 px card gets chopped in half. It took three more rounds to get to zero clipped words, and now it has a rule it follows: one measure per card, card height = 1.25 × the font size in px + 20, and every bit of text gets read in the screenshot before anything is called done.
It didn't get everything right, either. When I had it check its own sources afterwards, both October records were real and the waste figures held up, but four of the variety facts didn't. Baby Boo gives about ten fruits a plant, not 15 to 30, and Sweet Dumpling was first sold as "Vegetable Gourd". The country figures turned out to be an older FAOSTAT vintage that came via MapsOfWorld. So check the numbers. Always check the numbers.
I like the second Claude dashboard, and the animation. And the second Power BI dashboard, for something 100% AI-made, is rather impressive.
Wanna see how I make reports using only AI, or my design principles? Come see me at a user group or conference. Want to see me make accurate, pretty and functional Claude dashboards? Come see me on a Tugger webinar.