I'm at PBIBRUM on the 3rd of June talking all things Deneb.
Getting the presentation ready, I went back through every reference I'd built over the years. Some of them were fine. But I kept stopping mid-build to Google the same things, tab through the same docs pages, and paste the same code snippets from old files.
So I built a new one. A single reference for the things I reach for most often.
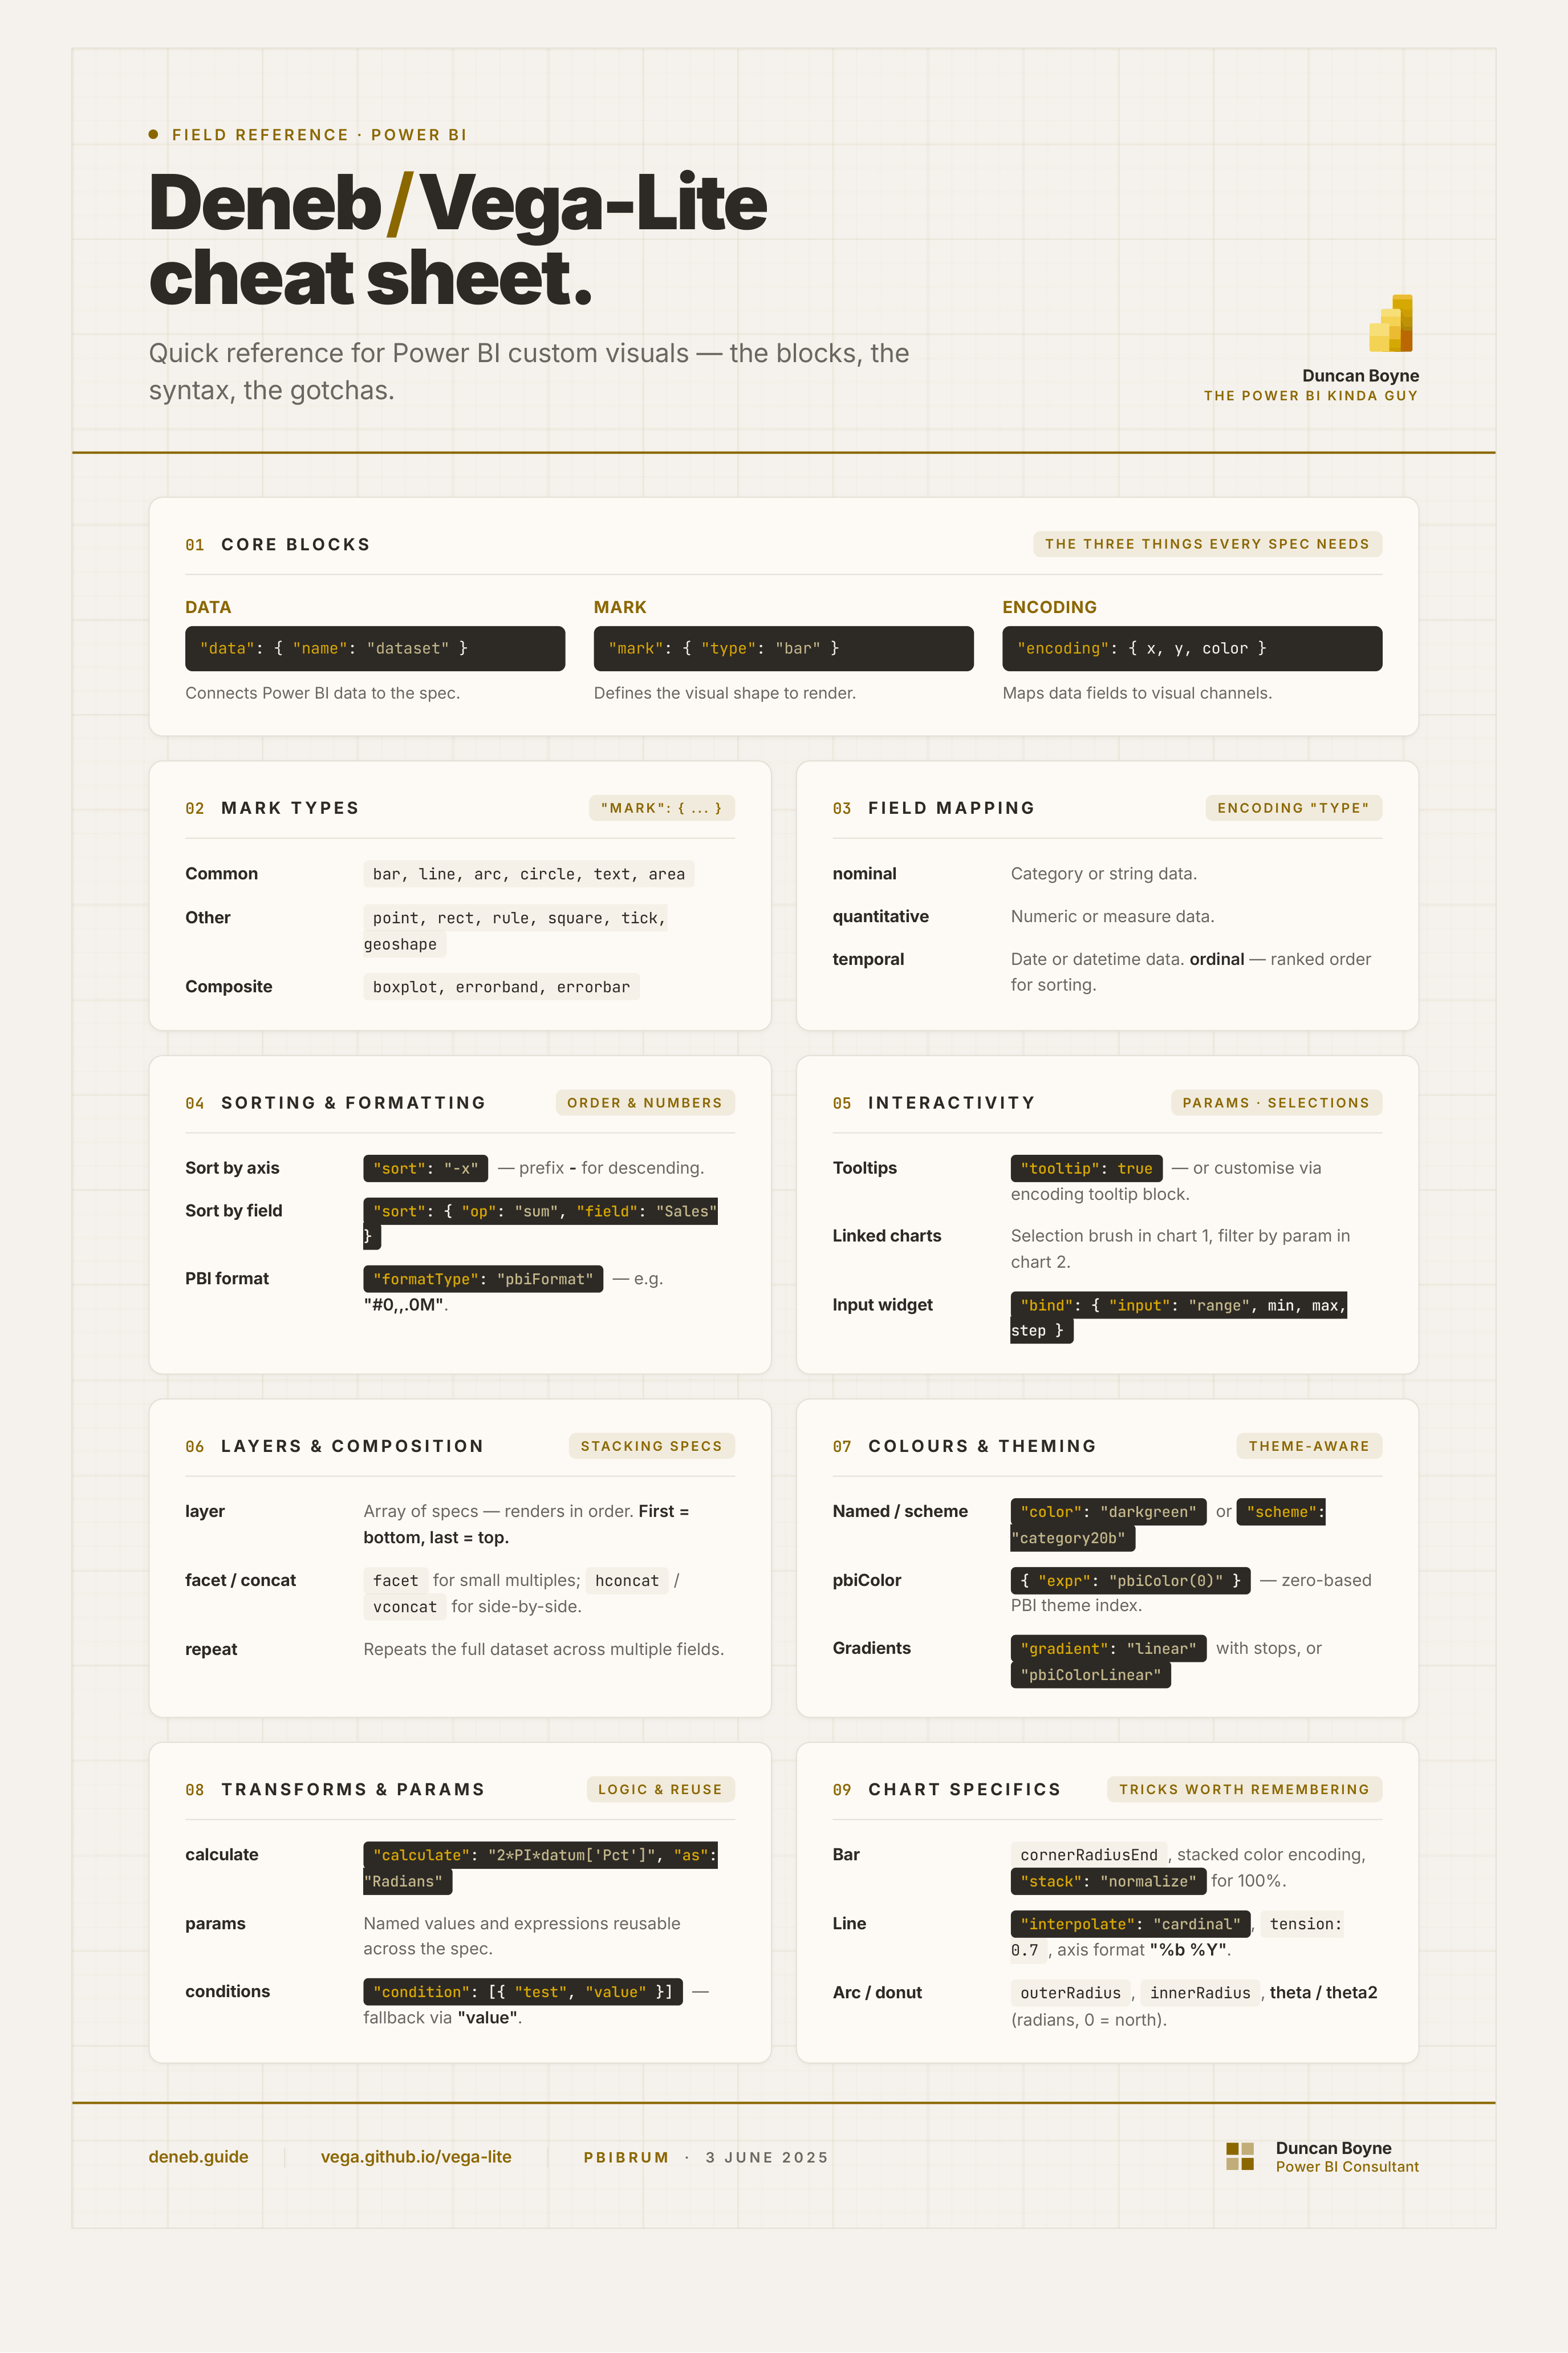
This is the long-form version. The cheat sheet graphic is at the top of this post if you want something you can pin to a second monitor. Everything below is the same content with more context and working examples.
The Three Things Every Deneb Spec Needs
A Deneb specification is just JSON. And every valid Vega-Lite specification needs exactly three things: data, mark, and encoding.
{
  "data": { "name": "dataset" },
  "mark": { "type": "bar" },
  "encoding": {
    "y": { "field": "Country", "type": "nominal" },
    "x": { "field": "Total Sales", "type": "quantitative" },
    "color": { "field": "Channel", "type": "nominal" }
  }
}
That is a complete, working bar chart. Everything else in this post is optional. Worth remembering when a spec is growing out of control.
Mark Types
The mark tells Vega-Lite what shape to draw. There are three groups.
Common marks you will use constantly:
bar line arc circle text area
Other marks for specific needs:
point rect rule square tick geoshape
Composite marks that handle their own aggregation:
boxplot errorband errorbar
Full reference: vega.github.io/vega-lite/docs/mark.html
Field Mapping Types
Every field in the encoding block needs a type. There are four.
| Type | Use when |
|---|---|
nominal |
The field is a string or category |
quantitative |
The field is a number or measure |
temporal |
The field is a date or datetime |
ordinal |
The field has a ranked order for sorting |
Getting this wrong is the most common reason a chart looks odd. A field treated as nominal when it should be quantitative will not aggregate. A field treated as quantitative when it should be nominal will try to plot numbers on an axis that should be showing names.
Full reference: vega.github.io/vega-lite/docs/type.html
Sorting
To sort an axis by another axis, add sort to its encoding block. Prefix with - for descending.
"y": { "field": "Country", "type": "nominal", "sort": "-x" }
To sort by a specific field with an aggregation:
"sort": {
  "op": "sum",
  "field": "Total Sales",
  "order": "descending"
}
Formatting with Power BI Format Strings
Deneb has a custom formatter that accepts Power BI format strings. Add formatType and format to the field definition in the encoding block.
"x": {
  "field": "Total Sales",
  "type": "quantitative",
  "formatType": "pbiFormat",
  "format": "#0,,.0M"
}
This keeps your number formatting consistent with the rest of the report. Full reference: deneb.guide/docs/formatting
Tooltips
To enable the default tooltip, add tooltip: true to the mark block.
"mark": { "type": "bar", "tooltip": true }
To customise which fields appear and how they are labelled, add a tooltip block to the encoding:
"tooltip": [
  { "field": "Country", "type": "nominal" },
  { "field": "Total Sales", "type": "quantitative", "title": "Sales" }
]
Full reference: deneb.guide/docs/interactivity-tooltips
Layers
Layers let you stack multiple marks on top of each other in the same visual. Each layer is its own specification inside a layer array.
{
  "data": { "name": "dataset" },
  "layer": [
    {
      "mark": { "type": "bar" },
      "encoding": {
        "x": { "field": "Total Sales", "type": "quantitative" },
        "y": { "field": "Country", "type": "ordinal" }
      }
    },
    {
      "mark": { "type": "text" },
      "encoding": {
        "x": { "field": "Total Sales", "type": "quantitative" },
        "y": { "field": "Country", "type": "ordinal" },
        "text": { "field": "Total Sales", "type": "quantitative" }
      }
    }
  ]
}
Layers render in order. First layer is at the bottom. Last layer is on top.
If multiple layers share the same encoding, move it outside the layer array to avoid repeating it.
{
  "data": { "name": "dataset" },
  "encoding": {
    "y": { "field": "Country", "type": "ordinal" }
  },
  "layer": [...]
}
The inner encoding inherits the outer encoding, but can override it.
Opacity
To set opacity on a mark directly:
"mark": { "type": "bar", "opacity": 0.3 }
To drive opacity from selection state (useful for cross-highlighting):
"opacity": {
  "condition": {
    "test": { "field": "__selected__", "equal": "off" },
    "value": 0.2
  },
  "value": 1
}
Full reference: vega.github.io/vega-lite/docs/mark.html#color
Titles
"title": {
  "text": "Total Sales by Country",
  "anchor": "start",
  "align": "left"
}
Full reference: vega.github.io/vega-lite/docs/title.html
Input Widgets
To add a slider or other input widget, use the params block with a bind property.
"params": [
  {
    "name": "tension",
    "value": 0,
    "bind": { "input": "range", "min": 0, "max": 1, "step": 0.1 }
  }
]
Then reference the parameter name anywhere in the spec with {"expr": "tension"}.
Full reference: vega.github.io/vega-lite/examples/interactive_query_widgets.html
Templates
Templates let you export a Deneb visual as a reusable .json file. Useful for sharing between reports or with colleagues.
To export:
- Click the Generate JSON Template icon in the Visual Editor toolbar
- Complete the Template Information and Dataset sections
- Click Download
To use an existing template:
- Create a native table visual and add the required columns
- Change the table to a Deneb visual
- In the Create or Import New Specification dialog, select Existing Template
- Browse to the
.jsonfile and click Create
Full reference: deneb.guide/docs/templates
Linked Charts
To link two charts so that selecting data in one filters the other, add a selection brush to the first visual:
"params": [{
  "name": "brush",
  "select": { "type": "interval", "encodings": ["x"] }
}]
Then filter by that selection in the second visual using a transform:
"transform": [{ "filter": { "param": "brush" } }]
Full reference: vega.github.io/vega-lite/examples/interactive_overview_detail.html
Extending Data with Transforms
To add derived fields to the dataset, use a transform block. Reference existing fields using datum['field name'] (or datum.fieldname if there are no spaces).
"transform": [
  { "calculate": "2 * PI * datum['Ring Percent']", "as": "Ring Radians" },
  { "calculate": "datum['Sales'] / datum['Target']", "as": "Attainment" }
]
Other useful transform types include filter, aggregate, flatten, fold, bin, and window.
Full reference: vega.github.io/vega-lite/docs/transform.html
Params for Named Values and Expressions
The params block is not only for widgets. It is also how you define named constants and reusable expressions.
"params": [
  { "name": "ring_max", "value": 200 },
  { "name": "ring_width", "value": 20 },
  { "name": "ring_gap", "value": 5 },
  { "name": "ring1_outer", "expr": "ring_max - ring_gap" }
]
Reference any parameter by name using {"expr": "param_name"} anywhere in the spec.
Full reference: vega.github.io/vega-lite/docs/parameter.html
Colours
Named CSS colours:
"mark": { "type": "area", "color": "darkgreen" }
Built-in Vega-Lite colour schemes:
"color": {
  "field": "Category",
  "scale": { "scheme": "category20b" }
}
Available schemes include dark2, set1, set2, tableau10, and others. Full list: vega.github.io/vega/docs/schemes
Power BI theme colours using pbiColor:
"color": { "value": { "expr": "pbiColor(0)" } }
The index is zero-based, so theme colour 1 = pbiColor(0).
Power BI theme colour schemes:
There are four integrations with the active Power BI theme:
| Scheme | Behaviour |
|---|---|
pbiColorNominal |
Matches the current theme colours |
pbiColorOrdinal |
Ramped scale from max to min divergent, excludes middle |
pbiColorLinear |
Interpolated gradient from max to min divergent, excludes middle |
pbiColorDivergent |
Same as linear, but includes the middle colour |
"color": {
  "field": "Value",
  "scale": { "scheme": "pbiColorLinear" }
}
Full reference: deneb.guide/docs/schemes
Gradient colours:
"color": {
  "x1": 1, "y1": 1, "x2": 1, "y2": 0,
  "gradient": "linear",
  "stops": [
    { "offset": 0, "color": "white" },
    { "offset": 1, "color": "darkgreen" }
  ]
}
Full reference: vega.github.io/vega-lite/docs/gradient.html
Bar Charts
Column chart (vertical bars): swap X and Y encoding so the category is on X and the measure is on Y.
Rounded corners:
"cornerRadiusEnd": 6
For more control: cornerRadiusTopLeft, cornerRadiusTopRight, cornerRadiusBottomLeft, cornerRadiusBottomRight.
Horizontal axis labels:
"axis": { "labelAngle": 0 }
Stacked bar chart: add a color block to the encoding.
"color": { "field": "Channel", "type": "nominal" }
100% stacked bar chart: add stack: normalize to the measure axis encoding.
"y": { "field": "Sales", "type": "quantitative", "stack": "normalize" }
Full reference: vega.github.io/vega-lite/docs/bar.html
Line Charts
Smoothing and tension:
"mark": {
  "type": "line",
  "interpolate": "cardinal",
  "tension": 0.7
}
Options include basis, monotone, natural, step. Full reference: vega.github.io/vega-lite/docs/line.html
Temporal axis formatting:
"axis": { "format": "%b %Y" }
D3 time format reference: github.com/d3/d3-time-format
Circular Charts
Pie chart:
"mark": { "type": "arc", "outerRadius": 100 }
Donut chart: add innerRadius.
"mark": { "type": "arc", "outerRadius": 100, "innerRadius": 60 }
Arc segment (for gauge-style visuals, radial charts, etc.):
"mark": {
  "type": "arc",
  "radius": 200,
  "radius2": 100,
  "theta": 0,
  "theta2": 5.9
}
theta and theta2 are in radians. 0 is north (top). A full circle is 2 * PI (approximately 6.28).
Full reference: vega.github.io/vega-lite/docs/arc.html
View Composition
There are four ways to combine multiple marks or views.
Layering (overlapping): covered above.
Concatenation (side by side or stacked):
"hconcat": [
  { "<<SPEC 1>>" },
  { "<<SPEC 2>>" }
]
Use vconcat for vertical stacking. Use concat with columns for wrapping.
Faceting (small multiples, one subset of data per view):
{
  "data": { "name": "dataset" },
  "facet": { "column": { "field": "Region" } },
  "spec": { "<<SHARED SPEC>>" }
}
Note: a layer cannot contain a facet, but a facet can contain a layer.
Repeating (full dataset, different fields per view):
{
  "data": { "name": "dataset" },
  "repeat": ["Sales", "Units", "Margin"],
  "columns": 2,
  "spec": {
    "mark": { "type": "bar" },
    "encoding": {
      "x": { "field": { "repeat": "repeat" }, "bin": true },
      "y": { "aggregate": "count" }
    }
  }
}
Full reference: vega.github.io/vega-lite/docs/composition.html
Conditions
To set a property value based on a test:
"color": {
  "condition": [
    { "test": "datum['Temp'] <= -20", "value": "#31578C" },
    { "test": "datum['Temp'] <= 5",  "value": "#B7D4EB" },
    { "test": "datum['Temp'] <= 25", "value": "#0E5358" }
  ],
  "value": "#850000"
}
The value outside the condition array is the fallback.
To drive a condition from a selection parameter rather than a test:
"color": {
  "condition": {
    "param": "brush",
    "field": "Category",
    "type": "nominal"
  },
  "value": "grey"
}
Full reference: vega.github.io/vega-lite/docs/condition.html
If-Then-Else Expressions
Two forms. Standard:
"color": { "expr": "if(datum['Sales'] > 10, 'green', 'red')" }
Ternary (shorter):
"color": { "expr": "datum['Sales'] > 10 ? 'green' : 'red'" }
Both work anywhere an expr block is accepted. To reference a field with spaces in the name, use datum['field name']. Without spaces, datum.fieldname also works.
Common math constants (PI, E, LN2, etc.) are available in expressions without importing anything.
Full reference: vega.github.io/vega/docs/expressions
Editor Font Size
Small thing, but worth knowing. To change the font size in the Deneb Visual Editor, go to Format Pane > Visual > Advanced Editor > JSON Editor > JSON Editor Font Size.
Full reference: deneb.guide/docs/visual-editor
Resources
These are the two docs I have open almost every time I build something in Deneb.
- deneb.guide — the official Deneb documentation, including Power BI-specific integrations
- vega.github.io/vega-lite — the full Vega-Lite specification reference
The Vega-Lite docs are dense. But the examples section is genuinely useful. If you know roughly what you want to build, searching the examples first is faster than reading the spec from the top.
I'm presenting on Deneb at PBIBRUM on the 3rd of June. If you're going, come and say hello.
The cheat sheet graphic is available at the top of this post. A dark mode version is also on my LinkedIn if you want something for a second monitor.