Reza Rad posted a poll last week. 294 votes. 64% said they use Claude and MCP Server for Power BI development.
I asked in the comments: of those, how many are pushing it through the full lifecycle - Figma MCP to wireframe the design, then Power BI CLI to build the report layer on top?
His reply: "That will be an interesting combination."
Nobody had documented it. So I built it. This is the honest account - what the full pipeline looks like when you run AI through all three layers, including the twelve things that went wrong and how to fix them.
Companion repo: github.com/DuncanBoyneJnr/power-bi-projects/tree/main/projects/retail-sales-ai-pipeline
The three layers most AI content skips
The AI-assisted Power BI conversation is almost entirely about two things: building the semantic model and generating individual visuals. Reza's video on building a model without opening Desktop. Bas Dohmen's series on generating charts with AI. Both genuinely useful. Both cover one layer.
A Power BI report has three.
The model layer - tables, relationships, measures. This is what powerbi-modeling-mcp covers.
The design layer - layout, colour scheme, visual hierarchy, report structure. This is what nobody is covering with AI.
The report layer - the PBIR file, visual bindings, themes, filters. This is what pbi-cli covers.
Skip the design layer and you get a functional report that looks like it was built by someone who did not think about it. The layout is whatever the CLI defaulted to. The colours are Power BI theme defaults. Nobody asked: what should this look like before we build it?
That question is what Figma MCP answers. And it is the step that makes the difference between a report people will use and one that ends up ignored after week two.
The build
Dataset: retail sales data from Kaggle. Five thousand transactions, two years of data, a clean star schema across four tables - Transactions, Customers, Products, Stores. The goal was a three-page report built entirely inside Claude Code without touching Power BI Desktop.
Tools: powerbi-modeling-mcp for the semantic model, Figma MCP for the design layer, pbi-cli for the report layer. All running inside Claude Code in VS Code. Desktop opened only at the end to verify the result.
The final PBIP, TMDL model, PBIR report files, theme JSON, screenshots, and notes are in the companion repo: Retail Sales AI Pipeline.
Total Desktop time: zero minutes until that final open.
Total session cost: 88% of an Opus 4.7 MAX session on a Pro plan.
The model layer
powerbi-modeling-mcp connects to a Power BI model three ways: a live Desktop instance, a Fabric workspace, or a local TMDL folder. The folder option is what makes Desktop-free building possible.
The first problem: pbi-cli scaffolds model.tmdl as the entry point. powerbi-modeling-mcp expects database.tmdl. The connection fails immediately:
Error connecting to folder: 'database.tmdl' not found
Fix - create the file manually:
database RetailSales
    compatibilityLevel: 1567
One line. Not in any documentation. It is the first thing that will stop you.
The second problem: the MCP keeps all changes in memory only. Every table_operations Create, every measure added - the MCP confirms success, nothing on disk changes. You have to call ExportTMDL and write the result back yourself. If you close the session without doing this, the model is empty.
Two more gotchas worth flagging before you hit them.
isKey: true is not allowed in Import mode tables. The MCP is explicit about it: key columns in non-DirectQuery models are managed automatically by the engine. Remove the flag.
Calculated tables reject column definitions at create time. The DAX expression defines the columns. Create the table first, then use column_operations to add formatting, sort-by assignments, and hidden flags separately.
Once past those four issues, the model build was clean. Five tables, four relationships, twelve measures across four display folders, a calculated DimDate marked as the date table - all via conversation.
-- DimDate calculated table
ADDCOLUMNS(
    CALENDAR(DATE(2023,9,1), DATE(2025,9,30)),
    "Year", YEAR([Date]),
    "Quarter", "Q" & FORMAT([Date], "Q"),
    "MonthNumber", MONTH([Date]),
    "MonthName", FORMAT([Date], "MMMM"),
    "YearMonth", FORMAT([Date], "YYYY-MM"),
    "DayOfWeek", FORMAT([Date], "dddd"),
    "IsWeekend", IF(WEEKDAY([Date],2) >= 6, TRUE, FALSE)
)
Full reference: github.com/microsoft/powerbi-modeling-mcp
The design layer
This is the step nobody publishes.
Before writing a single visual.json file, the design needs to exist somewhere. Not as a list of chart types. As an actual layout - where each visual sits, what size, what colours, what the hierarchy of information is on the page.
The prompt to Figma MCP:
Create a new Figma design file called "RetailSales Dashboard Wireframe".
Build 3 frames at 1280x720:
  Page 1: Overview - header, 4 KPI cards, revenue trend line,
                     region bars, category donut, top-5 table
  Page 2: Sales Performance - header, 4 KPI cards, YoY% column,
                     store bar chart, day-of-week chart, heatmap
  Page 3: Product Mix - header + slicer pills, 4 KPI cards,
                     category treemap, top-10 products, scatter

Canvas #1A1D2E, card #242840, primary #FF6B6B, secondary #4ECDC4,
tertiary #FFE66D, series #A78BFA #60A5FA, Inter font,
8px corner radius, left accent bar on each KPI card.
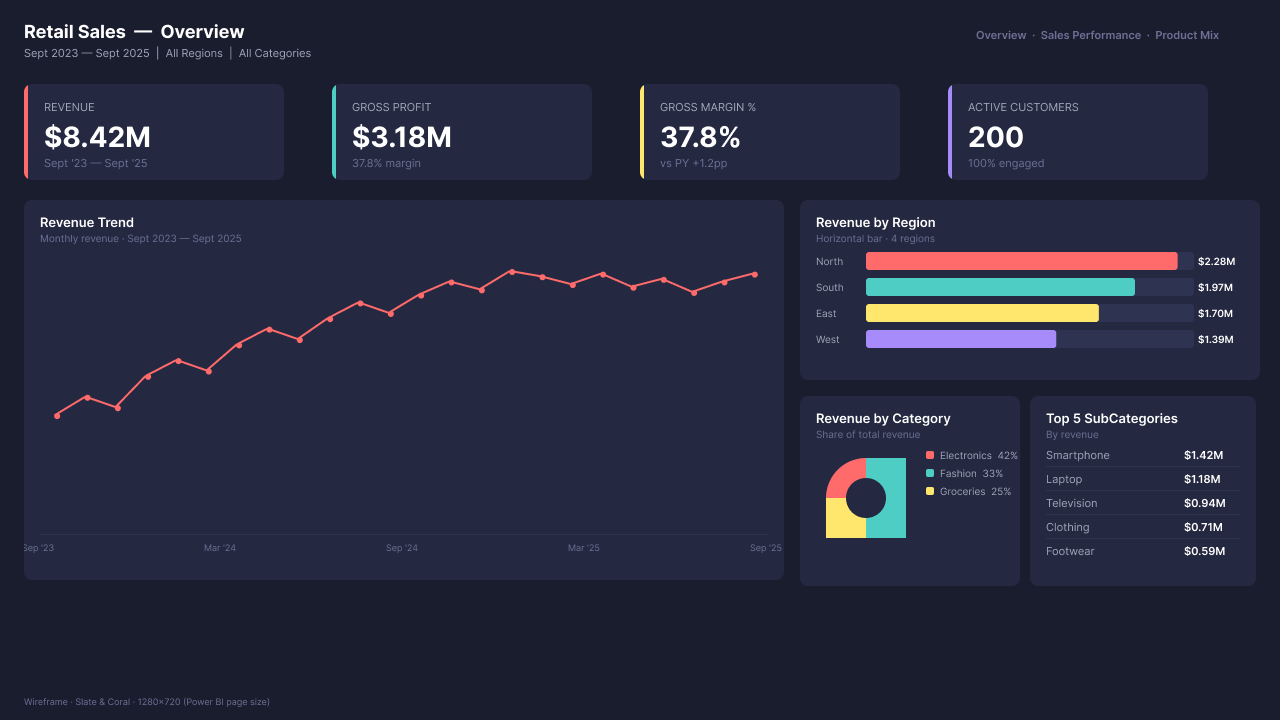
Three frames, all three pages, full colour theme - from a single prompt. The Figma file came back with pixel-accurate layouts at Power BI canvas size, every card and chart in position, the accent bar colours differentiating each KPI at a glance.
This became the specification. Everything built in the report layer was built to match it. The difference between a report that looks designed and one that looks assembled is whether this step happened.
| Figma wireframe | Final overview page |
|---|---|
 |
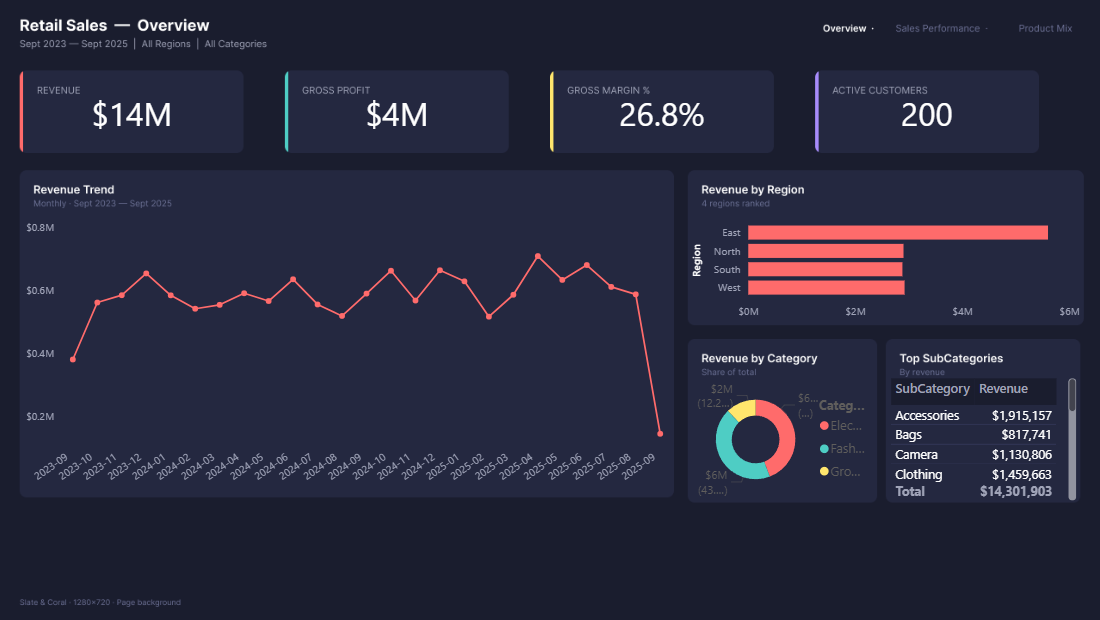 |
Figma wireframe on the left, final PBIR report output on the right. Same layout, same hierarchy, same theme - built without opening Desktop.
Full reference: figma.com/developers/mcp
The report layer
pbi-cli builds the PBIR report layer without Desktop. Scaffold, add pages, add visuals, bind data, set theme, validate.
pbi report create ./RetailSales --name "RetailSales"
pbi report add-page --display-name "Overview" --name overview
pbi visual add --page overview --type card --name revenue_card
pbi visual bind revenue_card --page overview --field "_Measures[Total Revenue]"
This works. The gotchas are where it gets expensive.
Visual bind defaults everything to Measure role. For a slicer, --field "Products[Category]" writes the field as a Measure reference. Slicers need Column. Result: the slicer loads with "Something's wrong with one or more fields." Fix: hand-edit visual.json and change the role wrapper from Measure to Column. Fifteen seconds once you know what to look for.
Scatter chart flags do not exist. The skill docs claim --x, --y, --size flags. The actual CLI has none of them. Three --value arguments all land in role Y, leaving X and Details empty. Fix: write the projection block in visual.json by hand with proper Category, X, Y, and Size roles.
Matrix --column flag does not exist either. Same problem - documented but absent. No way to bind matrix column groups from the command line. Workaround: switch the visual to a clusteredColumnChart with --legend for the column grouping.
add-topn filter breaks when ordering by a measure. The CLI wraps the order field as a Column reference. For measures, it needs a Measure reference. Desktop fails with:
CouldNotResolveModelReferencesInSemanticQuery
Could not resolve QueryDefinition due to invalid Column reference 'Revenue'
Fix - hand-edit the OrderBy block in the filter JSON, replacing the Aggregation wrapper with a Measure reference pointing to the correct source.
set-theme writes the wrong path. The CLI saves the theme file at StaticResources/RegisteredResources/slate-coral-theme.json but writes the path in report.json as BaseThemes/slate-coral-theme.json. Desktop throws "Failed to load the report" with only an Activity ID. Fix: move the file into a BaseThemes/ subfolder or correct the path in report.json.
OneDrive file locks. If your project folder syncs to OneDrive, pbi visual delete will occasionally fail with [WinError 5] Access is denied. OneDrive holds folders open during sync. Remove-Item -Recurse -Force in PowerShell clears it.
Full reference: github.com/MinaSaad1/pbi-cli
When Desktop opened it
Not on the first attempt. The theme path issue caused the first open to fail with an Activity ID and no other detail. The diagnostic rule that saved the most time: on a silent "Failed to load the report" error, strip the theme reference first. Confirm the model and visuals load clean. Add the theme back with the corrected path. Theme issues account for a disproportionate share of these failures and there is no visible error detail to guide you.
Once loaded, two more fixes.
All charts rendering in a single colour: add "showAllDataPoints": true to the dataPoint objects block in each visual. Without it, single-dimension charts default to the first theme colour for every bar.
The Revenue YoY % measure returning -100% for the most recent incomplete period:
Revenue YoY % =
VAR _Curr = [Total Revenue]
VAR _PY = CALCULATE([Total Revenue], SAMEPERIODLASTYEAR('DimDate'[Date]))
RETURN
IF(
    ISBLANK(_PY) || _PY = 0,
    BLANK(),
    DIVIDE(_Curr - _PY, _PY)
)
After those fixes: three pages, live data, Slate & Coral theme applied. The treemap showing Electronics, Fashion, and Groceries in the three primary accent colours exactly as the Figma wireframe specified. The scatter chart showing SubCategory revenue against gross margin %, bubble size driven by units sold. The design layer translated into the report layer.
What the pipeline looks like in practice
| Step | Tool | Output |
|---|---|---|
| Dataset analysis | Conversation | Schema, relationships, measure list |
| Project scaffold | pbi-cli | .pbip folder structure |
| Model build | powerbi-modeling-mcp | 5 tables, 4 relationships, 12 measures |
| Wireframe and design | Figma MCP | 3 frames, full colour theme, 1280x720 |
| Report build | pbi-cli | 24 visuals across 3 pages |
| Validation | pbi-cli | 30 files, no errors |
What worked without friction: the semantic model build once database.tmdl was in place, the Figma wireframes, and page background images exported from Figma directly into the report.
What required manual intervention: scatter chart bindings, treemap role names, slicer field types, TopN filter measure references, theme path.
None of those are blockers. They are fifteen-second edits once you know what to look for. The twelve gotchas above are the complete list.
What to do differently
Open the .pbip in Desktop after the semantic model step, before touching the report layer. Model issues caught at that point cost almost nothing. The same issues caught after 24 visuals are built on top cost an hour.
Validate visual.json field roles before trusting the CLI binding. Any field from a dimension table is a Column. Only measures are Measures. The CLI does not infer this correctly for slicers, table visuals, or scatter charts.
Build a smoke test first: one KPI card, one bar chart, one line chart. Open it in Desktop. Confirm it loads and renders correctly. Then build the other visuals.
On the first "Failed to load the report": strip the theme. Not the fourth attempt.
What's in the repo
I have put the final project files on GitHub: the PBIP structure, TMDL model, PBIR report layer, theme file, screenshots, and notes on every manual fix. The dataset source is documented in the repo as well.
Repo: github.com/DuncanBoyneJnr/power-bi-projects/tree/main/projects/retail-sales-ai-pipeline