Open the visuals pane in Power BI and look for a heatmap. You won't find one. Bar, line, matrix, map, plenty of choices, but no heatmap. There never has been one.
A year ago I posted a heatmap tutorial that coloured revenue by region and month. It did the job, but it always nagged at me that a heatmap built that way can only ever show one number at a time. This post is the upgrade: a heatmap that shows two measures in the same cell, built entirely in Deneb.
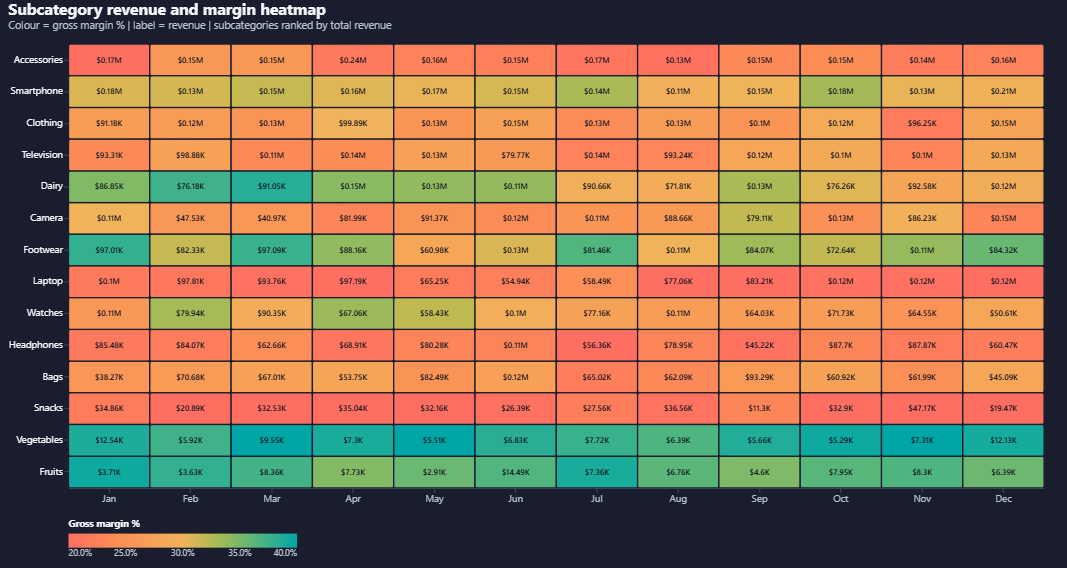
Colour is gross margin %. The label in each cell is revenue. Rows are subcategories ranked by total revenue, biggest on top. The coral rows jump out as your thin-margin lines, even where the sales numbers look healthy. One grid, two stories.
Why not just use the Matrix?
You can hack a heatmap out of a Matrix visual with conditional formatting on the background colour. I've shipped plenty of them. But the limits show quickly:
- One measure drives the colour. You shade by revenue, or by margin, never both. The second number is gone.
- Colour control is fiddly. You get a min/centre/max picker, not a real anchored scale, so the gradient drifts every time the data refreshes.
- It still looks like a spreadsheet. Grey headers, subtotals, gridlines. Useful in a meeting, easy to scroll past on a feed.
Marketplace visuals are the other route, but a third-party heatmap brings certification questions, tenant approval, and another dependency to govern.
A proper two-measure heatmap isn't something you pick from a list. You build it, and Deneb (the Vega-Lite visual for Power BI) is the cleanest way to do it.
The idea: two measures, one cell
Vega-Lite lets you stack marks in layers. The trick here is two layers sharing the same grid:
- A rect mark, one rounded square per subcategory and month, coloured by gross margin %.
- A text mark sitting on top of it, printing revenue inside each square.
Colour carries quality, the label carries size, and the eye reads both in a single pass.
Step 1: the fields
Deneb renders whatever you drop into the Values well. This heatmap needs six fields, grouped by the job they do.
| Field | Role | Why |
|---|---|---|
SubCategory (Products) |
Row axis | One row per subcategory |
Month (DimDate) |
Column axis | Jan to Dec across the top |
MonthNum (DimDate, hidden) |
Sort key | Forces calendar order, not alphabetical |
Revenue (measure) |
Cell label | Printed in every square |
Gross Margin % (measure) |
Cell colour | Drives the coral-to-teal gradient |
Units Sold, Transaction Count (measures) |
Tooltip only | Extra context on hover |
Both Revenue and Gross Margin % are real model measures. That matters: Power BI can only apply its own format strings (pbiFormat) to genuine measures and columns, not to values invented inside a Vega transform.
Step 2: colour the square (the rect layer)
The first layer is a rect mark coloured by margin. The important part is the scale: pin it to a three-stop domain so coral, amber and teal always mean the same band of margin, refresh after refresh.
"color": {
  "field": "GrossMarginPct",
  "type": "quantitative",
  "scale": {
    "domain": [0.2, 0.3, 0.4],
    "range": ["#FF6F61", "#F0B35A", "#00A6A6"],
    "clamp": true
  }
}
clamp: true keeps an outlier from stretching the whole gradient flat. Tune the three domain stops to your own margin spread, if everything comes out one colour, your values sit outside 0.2 to 0.4.
Step 3: print the money (the text layer)
The second layer is a text mark bound to revenue. Let Power BI abbreviate to K and M with auto units.
"mark": { "type": "text", "fontSize": 9, "fontWeight": 600, "color": "#10131F" },
"encoding": {
  "text": {
    "field": "Revenue",
    "format": "$#,##0",
    "formatType": "pbiFormatAutoUnit"
  }
}
Dark text (#10131F) is deliberate, it stays readable across every colour in the coral-to-teal range.
Step 4: sort the axes
Two sorts make the grid readable:
- Columns sort on
MonthNumso months run Jan to Dec, not Apr, Aug, Dec. - Rows sort on summed
Revenue, descending, so the biggest subcategories sit at the top.
"x": { "field": "Month", "type": "ordinal",
       "sort": { "field": "MonthNum", "op": "min", "order": "ascending" } },
"y": { "field": "SubCategory", "type": "nominal",
       "sort": { "field": "Revenue", "op": "sum", "order": "descending" } }
The gotchas
Three things will catch you out the first time.
1. formatType without a format string renders every value as undefined. pbiFormat tells Deneb which formatter to call. It does not borrow the measure's model format string. Always set both together.
2. d3 format strings are not Power BI format strings. A d3 string like $,.0f paired with pbiFormat also renders undefined. Pick one system per field: a d3 string with no formatType, or a Power BI string with formatType: "pbiFormat".
3. Cross-highlight has to be on both layers. Apply the __selected__ opacity condition to the rect and the text. Miss the text layer and a click dims the cells while the labels stay bright.
"opacity": {
  "condition": { "test": { "field": "__selected__", "equal": "off" }, "value": 0.25 },
  "value": 1
}
The full spec
Drop this into the Deneb specification editor with the six fields above in the Values well.
{
  "$schema": "https://vega.github.io/schema/vega-lite/v5.json",
  "background": "transparent",
  "data": {
    "name": "dataset"
  },
  "width": "container",
  "height": "container",
  "autosize": {
    "type": "fit",
    "contains": "padding"
  },
  "title": {
    "text": "Subcategory revenue and margin heatmap",
    "subtitle": "Colour = gross margin %  |  label = revenue  |  subcategories ranked by total revenue",
    "anchor": "start",
    "color": "#F4F7FB",
    "subtitleColor": "#B7C0CC",
    "fontSize": 18,
    "subtitleFontSize": 12,
    "offset": 14
  },
  "encoding": {
    "x": {
      "field": "Month",
      "type": "ordinal",
      "sort": {
        "field": "MonthNum",
        "op": "min",
        "order": "ascending"
      },
      "axis": {
        "title": null,
        "labelAngle": 0,
        "labelColor": "#B7C0CC",
        "labelFontSize": 11,
        "tickColor": "#445064",
        "domainColor": "#445064"
      }
    },
    "y": {
      "field": "SubCategory",
      "type": "nominal",
      "sort": {
        "field": "Revenue",
        "op": "sum",
        "order": "descending"
      },
      "axis": {
        "title": null,
        "labelColor": "#F4F7FB",
        "labelFontSize": 11,
        "tickColor": "#445064",
        "domain": false
      }
    }
  },
  "layer": [
    {
      "mark": {
        "type": "rect",
        "cornerRadius": 2,
        "stroke": "#1A1D2E",
        "strokeWidth": 1.5,
        "tooltip": true
      },
      "encoding": {
        "color": {
          "field": "GrossMarginPct",
          "type": "quantitative",
          "scale": {
            "domain": [
              0.2,
              0.3,
              0.4
            ],
            "range": [
              "#FF6F61",
              "#F0B35A",
              "#00A6A6"
            ],
            "clamp": true
          },
          "legend": {
            "title": "Gross margin %",
            "orient": "bottom",
            "format": "0.0%",
            "formatType": "pbiFormat",
            "labelColor": "#B7C0CC",
            "titleColor": "#F4F7FB",
            "gradientLength": 260
          }
        },
        "opacity": {
          "condition": {
            "test": {
              "field": "__selected__",
              "equal": "off"
            },
            "value": 0.25
          },
          "value": 1
        },
        "tooltip": [
          {
            "field": "SubCategory",
            "title": "Subcategory"
          },
          {
            "field": "Month",
            "title": "Month"
          },
          {
            "field": "Revenue",
            "type": "quantitative",
            "title": "Revenue",
            "format": "$#,##0",
            "formatType": "pbiFormat"
          },
          {
            "field": "GrossMarginPct",
            "type": "quantitative",
            "title": "Gross margin",
            "format": "0.0%",
            "formatType": "pbiFormat"
          },
          {
            "field": "UnitsSold",
            "type": "quantitative",
            "title": "Units sold",
            "format": "#,##0",
            "formatType": "pbiFormat"
          },
          {
            "field": "TransactionCount",
            "type": "quantitative",
            "title": "Transactions",
            "format": "#,##0",
            "formatType": "pbiFormat"
          }
        ]
      }
    },
    {
      "mark": {
        "type": "text",
        "fontSize": 9,
        "fontWeight": 600,
        "color": "#10131F",
        "tooltip": true
      },
      "encoding": {
        "text": {
          "field": "Revenue",
          "type": "quantitative",
          "format": "$#,##0",
          "formatType": "pbiFormatAutoUnit"
        },
        "opacity": {
          "condition": {
            "test": {
              "field": "__selected__",
              "equal": "off"
            },
            "value": 0.25
          },
          "value": 1
        }
      }
    }
  ],
  "config": {
    "view": {
      "stroke": null
    },
    "axis": {
      "grid": false
    },
    "font": "Segoe UI"
  }
}
Make it your own
The pattern travels. Anywhere a cell has a size and a quality, this layout shows both:
- Region by month instead of subcategory, for a store-geography view.
- Cohort retention, signup month down the side, months-since across the top, colour by retention and label the headcount.
- Capacity or utilisation, colour by percent used, label the raw hours.
Once it clicks, you stop reaching for the Matrix visual.
Generate visuals like this with AI
I've packaged everything I know about building Power BI Deneb visuals into an open-source Claude Skill: the Deneb Visual Skill. It teaches Claude to generate, adapt, debug and review Deneb specs with proper data binding, Power BI formatting, cross-highlighting and theme-aware colour, the same rules this heatmap follows.
It's free and on GitHub: github.com/DuncanBoyneJnr/Deneb-Visual-Skill
Install it, describe the visual you want, and let Claude write the spec.